
Waters (WAT) · Life Sciences
Waters Q2 2026 earnings: summary, key numbers & outlook
Results filed 4 Aug 2026 · Quarter ended 4 Jul 2026
Slides (33 pages)Press release ↗Investor relations ↗
Summaries and transcripts are machine-generated and can contain errors.
In brief
Waters' first full quarter owning BD's biosciences and diagnostics businesses showed mid-single-digit growth there, while a broadening instrument replacement recovery lifted its core analytical business.
Waters completed its first full quarter with the Biosciences and Diagnostic Solutions businesses acquired from BD, and they grew 4% on a comparable basis, faster than management expected. Its core Analytical Sciences business saw instrument and chemistry consumables demand strengthen, with Pharma and Academic & Government customers leading and previously lagging segments returning to growth. Management credits a 180-day plan covering pricing, reagent compliance and share recovery in flow cytometry research products.
Management is steering toward revenue synergies from the acquisition, such as service attachment, e-commerce, cross-selling and new products. It is also pursuing replacement of aging flow cytometry and blood culture instruments, with new launches starting in the second half. The main tension is execution: integration, cost actions and a continued decline in China diagnostics must deliver while the market recovery holds. Management is raising every component of full-year guidance.
Slides & documents
Open the slide deck (PDF, 33 pages) ↗
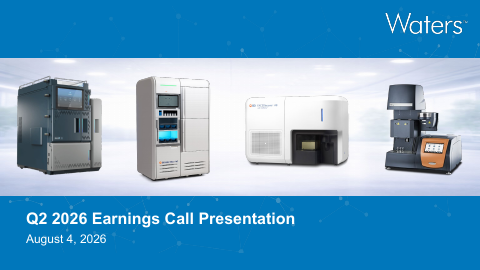
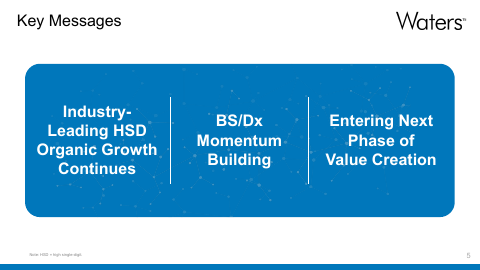
Showing the first 6 of 33 pages.
From Waters investor relations
SEC filing
Key numbers
- Total revenue · GAAP
- $1.645 billion
- Net (loss) income · GAAP
- -$136.0M
- Diluted EPS · GAAP
- ($1.39)
- Adjusted EPS · non-GAAP
- $3.05
- Adjusted gross margin · non-GAAP
- 54.0%
- Operating (loss) income · GAAP
- -86.0M
- Adjusted operating margin · non-GAAP
- 25.0%
- Net cash provided by operating activities · GAAP
- 200.0M
up 113% from a year ago
compared with income of $147 million a year ago
compared with $2.47 a year ago
up 3% from $2.95 a year ago
compared with income of $188 million a year ago
compared with 29.1% a year ago
compared with $41 million a year ago
| Segment or metric | Value | Change |
|---|---|---|
| Analytical Sciences Division | $669.0M | up 7% as reported |
| Biosciences Division | $368.0M | up 3% on a prior year comparable basis |
| Advanced Diagnostics Division | $521.0M | up 7% on a prior year comparable basis |
| Materials Sciences Division | $87.0M | up 6% as reported |
| Diagnostic Solutions | $449.0M | compared with $425 million in the prior year comparable period |
| Clinical Business Unit | $72.0M | compared with $62 million a year ago |
| ASD instrument revenue | $240.0M | up 8% in constant currency |
Where each number comes from
- Total revenue: “Total reported revenue of $1.645 billion surpassed the high end of the guidance range, driven by broad-based outperformance across both organic revenue and the acquired businesses.”
- Net (loss) income: “Net (loss) income | $(136) | $147 | $(208) | $268 Net (loss) income per basic common share”
- Diluted EPS: “GAAP EPS of ($1.39); Adjusted EPS of $3.05 landed at the high end of the guidance range, as early cost actions offset unfavorable foreign exchange translation.”
- Adjusted EPS: “Adjusted EPS for the second quarter of 2026 grew 3% to $3.05, compared to $2.95 for the second quarter of 2025.”
- Adjusted gross margin: “Adjusted Gross & Operating Margin 889 54.0% 411 25.0%”
- Operating (loss) income: “Operating (loss) income | (86) | 188 | (134) | 340 Other (expense) income, net”
- Adjusted operating margin: “Adjusted Non-GAAP | $756 | $357 | $121 | $411 | 25.0% | $(55) | $356 | $(56) | $301 | $3.05”
- Net cash provided by operating activities: “Net cash provided by operating activities | 200 | 41 | 198 | 301 Cash flows from investing activities”
- Analytical Sciences Division: “Analytical Sciences Division (ASD) | $669 | $627 | 7% Biosciences Division (WBD) | 368 | — | **”
- Biosciences Division: “Biosciences Division (WBD) | 368 | — | ** Advanced Diagnostics Division (ADx) | 521 | 62 | 733%”
- Advanced Diagnostics Division: “Advanced Diagnostics Division (ADx) | 521 | 62 | 733% Materials Sciences Division (MSD) | 87 | 82 | 6%”
- Materials Sciences Division: “Materials Sciences Division (MSD) | 87 | 82 | 6% Total Revenue | $1,645 | $771 | 113%”
- Diagnostic Solutions: “The Diagnostic Solutions business delivered reported revenue of $449 million in the quarter, compared to $425 million for the prior year comparable period.”
- Clinical Business Unit: “The Clinical Business Unit delivered reported revenue of $72 million in the quarter, compared to $62 million for the second quarter of 2025.”
- ASD instrument revenue: “ASD Instrument Revenue | $240 | $229 | 5% Currency Translation Impact | (3%) Constant Currency ASD Instrument Revenue Growth | 8%”
Copied from the press release ↗ and other documents in the SEC filing ↗. A figure is published only if its sentence is in those documents.
| From the filing | Q2 2026 | vs year ago | vs last quarter |
|---|---|---|---|
| Revenue | $1.6B | +113.3% | +29.8% |
| Operating income | -$86.0M | — | −83.0% |
| Net income | -$136.0M | — | −88.9% |
| Diluted EPS | -$1.39 | — | −59.8% |
| Free cash flow | $153.0M | +750.0% | — |
| Operating margin | -5.2% | −29.6 pts | −1.5 pts |
Calculated by code from XBRL, not by the model.
Outlook
| Metric | Period | Outlook |
|---|---|---|
| Total reported revenue | third quarter of 2026 | $1.745 billion to $1.762 billion |
| Organic constant currency revenue growth | third quarter of 2026 | 8% to 10% |
| Adjusted EPS | third quarter of 2026 | $3.95 to $4.05 |
| Total reported revenue | full-year 2026 | $6.415 billion to $6.476 billion |
| Organic constant currency revenue growth | full-year 2026 | 7.0% to 9.0% |
| Adjusted EPS | full-year 2026 | $14.45 to $14.65 |
Key takeaways
BD businesses accelerated under Waters' 180-day plan
Biosciences and Diagnostic Solutions grew 4% on a comparable basis, which management says is a faster-than-expected move to mid-single-digit growth. The plan focuses on urgency, pricing and reagent compliance, and regaining share in flow research products.
Instrument recovery has broadened beyond Pharma
Analytical Sciences instruments grew 8% in constant currency, with chemistry consumables up double digits. Pharma grew 11% and Academic & Government 11%, and previously lagging segments are returning to growth.
New flow cytometry and blood culture products drive replacement
Waters introduced the FACSDiscover A7 spectral cell analyzer and began BACTEC FXI placements. It says 10,000+ of ~25,000 flow cytometry installed-base units have aged, and 12,000+ BACTEC systems are past due for replacement, with the opportunity starting in 2H26.
Revenue synergies are the next phase of integration
Management says the acquisition is moving from operational fixes to a first tranche of revenue synergies. These include service plan attachment, e-commerce, cross-selling and new bioseparations products, with taking flow into pharma QC and MALDI-TOF later.
Full-year guidance raised on broader market strength
Waters raised every component of its 2026 outlook, citing better-than-expected results and strengthening end markets. China microbiology remains a drag, declining 13% though better than expected.
Charts
Data
| Q4 2024 | $872.7M |
| Q1 2025 | $661.7M |
| Q2 2025 | $771.3M |
| Q3 2025 | $799.9M |
| Q4 2025 | $932.4M |
| Q1 2026 | $1.3B |
| Q2 2026 | $1.6B |
| Q3 2026 | $1.8B |
Data
| Q4 2024 | $3.88 |
| Q1 2025 | $2.03 |
| Q2 2025 | $2.47 |
| Q3 2025 | $2.50 |
| Q4 2025 | $3.77 |
| Q1 2026 | -$0.87 |
| Q2 2026 | -$1.39 |
| Q3 2026 | $0.82 |
Fourth-quarter EPS appears once the press release is read; filings report it only for the full year.
Data
| Q4 2024 | 33.5% |
| Q1 2025 | 22.9% |
| Q2 2025 | 24.4% |
| Q3 2025 | 24.0% |
| Q4 2025 | 29.0% |
| Q1 2026 | -3.7% |
| Q2 2026 | -5.2% |
| Q3 2026 | 7.2% |
Data
| Q1 2025 | $234.0M |
| Q2 2025 | $18.0M |
| Q3 2025 | $162.0M |
| Q4 2025 | $125.8M |
| Q1 2026 | -$42.0M |
| Q2 2026 | $153.0M |
| Q3 2026 | $54.0M |
Operating cash flow minus capital expenditure, from cash flow statements.
Questions
What changed at Waters' newly acquired BD businesses this quarter?
In their first full quarter under Waters, the Biosciences and Diagnostic Solutions businesses grew 4% on a comparable basis, ahead of guidance. Management credits a 180-day plan covering pricing, reagent compliance and regaining flow research share.
Where is demand coming from in Waters' core analytical business?
Pharma grew 11% in constant currency, driven by instrument replacement, GLP-1s, generics and biologics, and Academic & Government grew 11%. Biotech and CRO spending also improved, and lagging customer segments are returning to growth.
Which new products is Waters launching?
Waters introduced the FACSDiscover A7 spectral flow cytometry analyzer and began placing the BACTEC FXI blood culture system, launched in 2026. Both target instrument replacement opportunities starting in the second half.
What are the main competitive or risk factors in diagnostics?
Microbiology in China declined 13%, though better than expected, while microbiology outside China grew 6%. Integration execution and realizing synergies are also flagged as risks.
How is management positioning Waters for growth beyond 2026?
It points to moving from operational improvements to revenue synergies such as service attachment, e-commerce and cross-selling. It also sees reshoring as a 2027-30 tailwind, with 37 of 76 tracked U.S. expansion sites under construction.