
Verisk (VRSK) · Exchanges & Data
Verisk Q3 2026 earnings: summary, key numbers & outlook
Results filed 5 Nov 2026 · Quarter ended 30 Sep 2026
Slides (22 pages)Official transcript (PDF) ↗Press release ↗Investor relations ↗
Summaries and transcripts are machine-generated and can contain errors.
In brief
Verisk is pushing AI-powered products and network effects, launching MCP Connectors with Microsoft and Amazon and a Synergy Studio platform, while subscription demand drives its fastest growth in a year.
Verisk's subscription base is expanding as insurers adopt new solutions in forms, rules and loss costs, catastrophe risk and anti-fraud. Underwriting growth reached 7.7% and Claims 6.7% on an organic constant currency basis. Transactional activity was mixed: Life Solutions services were stronger, but property and restoration volumes stayed weak on light weather, and U.S. and Canada property activity was softer.
Management is steering toward AI-enabled products and cross-industry network effects. It launched MCP Connectors with Microsoft and Amazon, made more content available via Claude, released Synergy Studio's first quarterly update, and added 5 Core Lines Reimagine modules. The tension is that transactional lines depend on weather and property activity, while insurers and regulators will expect AI outputs to be explainable. A pending deal also awaits FTC review.
No call transcript for this quarter, so this summary also draws on: Webull (Motley Fool transcript) ↗.
Slides & documents
Open the slide deck (PDF, 22 pages) ↗

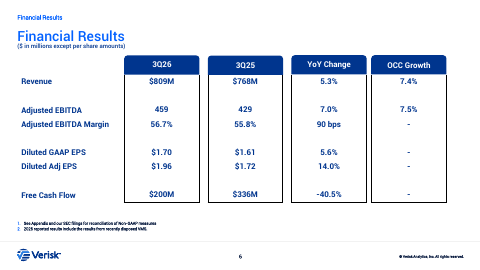
Showing the first 6 of 22 pages.
From Verisk investor relations
SEC filing
Key numbers
- Revenue · GAAP
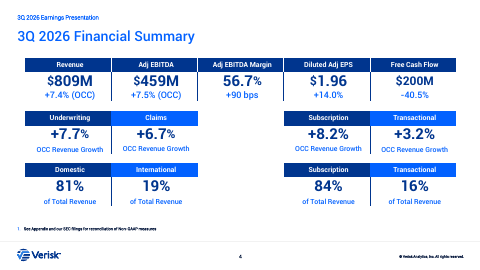
- $809 million
- Net income · GAAP
- $219 million
- Diluted GAAP EPS · GAAP
- $1.70
- Diluted adjusted EPS · non-GAAP
- $1.96
- Adjusted EBITDA · non-GAAP
- $459 million
- Operating cash flow · GAAP
- $267 million
- Free cash flow · non-GAAP
- $200 million
up 5.3%
down 2.8%
up 5.6%
up 14.0%
up 7.0%
down 33.8%
down 40.5%
| Segment or metric | Value | Change |
|---|---|---|
| Underwriting revenue | $568.0M | up 4.8%; up 7.7% OCC |
| Claims revenue | 241.0M | up 6.6%; up 6.7% OCC |
| Subscription revenue growth (OCC) | 8.2% | |
| Transactional revenue growth (OCC) | 3.2% |
Where each number comes from
- Revenue: “Revenue was $809 million, up 5.3%, and up 7.4% on an organic constant currency (OCC) basis, a non-GAAP measure.”
- Net income: “Net income was $219 million, down 2.8%. ● | Adjusted EBITDA, a non-GAAP measure, was $459 million, up 7.0%, and up 7.5% on an OCC basis.”
- Diluted GAAP EPS: “Diluted GAAP earnings per share (EPS) was $1.70, up 5.6%. ● | Diluted adjusted EPS, a non-GAAP measure, was $1.96, up 14.0%.”
- Diluted adjusted EPS: “Diluted GAAP earnings per share (EPS) was $1.70, up 5.6%. ● | Diluted adjusted EPS, a non-GAAP measure, was $1.96, up 14.0%.”
- Adjusted EBITDA: “Net income was $219 million, down 2.8%. ● | Adjusted EBITDA, a non-GAAP measure, was $459 million, up 7.0%, and up 7.5% on an OCC basis.”
- Operating cash flow: “Net cash provided by operating activities was $267 million, down 33.8% and free cash flow, a non-GAAP measure, was $200 million, down 40.5%.”
- Free cash flow: “Net cash provided by operating activities was $267 million, down 33.8% and free cash flow, a non-GAAP measure, was $200 million, down 40.5%.”
- Underwriting revenue: “Three Months Ended September 30, | % Change 2026 | 2025 | Reported | OCC Underwriting | $568 | $542 | 4.8% | 7.7% Claims | 241 | 226 | 6.6 | 6.7”
- Claims revenue: “Three Months Ended September 30, | % Change 2026 | 2025 | Reported | OCC Underwriting | $568 | $542 | 4.8% | 7.7% Claims | 241 | 226 | 6.6 | 6.7”
- Subscription revenue growth (OCC): “OCC revenue increased 7.4% with strong subscription growth of 8.2% and transactional growth of 3.2%.”
- Transactional revenue growth (OCC): “OCC revenue increased 7.4% with strong subscription growth of 8.2% and transactional growth of 3.2%.”
Copied from the press release ↗ and other documents in the SEC filing ↗. A figure is published only if its sentence is in those documents.
| From the filing | Q3 2026 | vs year ago | vs last quarter |
|---|---|---|---|
| Revenue | $809.0M | +5.3% | +0.3% |
| Operating income | $365.3M | +5.6% | +0.4% |
| Net income | $219.2M | −2.8% | −4.1% |
| Diluted EPS | $1.70 | +5.6% | −2.9% |
| Free cash flow | $200.0M | −40.5% | −32.9% |
| Operating margin | 45.2% | +0.2 pts | +0.1 pts |
Calculated by code from XBRL, not by the model.
Outlook
| Metric | Period | Outlook |
|---|---|---|
| Total revenue | full year 2026 | $3,190 – $3,240M |
| Adjusted EBITDA | full year 2026 | $1,790 – $1,830M |
| Adjusted EBITDA margin | full year 2026 | 56.0% – 56.5% |
| Diluted adjusted EPS | full year 2026 | $7.45 – $7.75 |
| Tax rate | full year 2026 | 23% – 26% |
| Capital expenditures | full year 2026 | $260 – $280M |
Key takeaways
MCP Connectors put Verisk data inside AI assistants
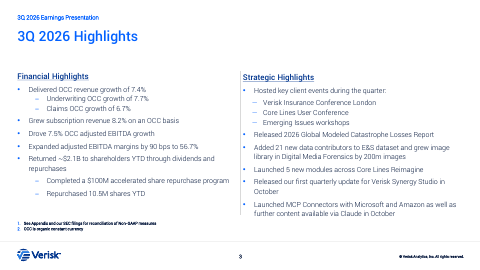
Verisk launched MCP Connectors with Microsoft and Amazon and made further content available via Claude in October. This extends its data into the AI tools clients already use.
Synergy Studio is gaining early client traction
Verisk released the first quarterly update for Verisk Synergy Studio in October. Early commentary on the call cited 14 companies using it since the mid-September beta, and 16 clients running a related platform.
Core Lines Reimagine added five new modules
Verisk launched 5 new modules across Core Lines Reimagine and hosted a Core Lines User Conference. This signals continued modernization of its forms, rules and loss costs franchise.
Clients are expanding and extending subscriptions
Subscription growth reflected clients expanding relationships in Forms, Rules & Loss Costs and Catastrophe Risk Solutions as they adopt new solutions. Strong renewals and new logos in Anti-Fraud also contributed.
Weather and property softness still weigh on transactions
Property and Restoration Solutions faced below-average weather-related volumes, and transactional activity was softer in U.S. and Canada property lines. Stronger Life Solutions services partly offset this.
Charts
Fourth quarter worked out from the annual figure.
Data
| Q4 2024 | $735.6M * |
| Q1 2025 | $753.0M |
| Q2 2025 | $772.6M |
| Q3 2025 | $768.3M |
| Q4 2025 | $778.8M * |
| Q1 2026 | $782.6M |
| Q2 2026 | $806.3M |
| Q3 2026 | $809.0M |
Data
| Q1 2025 | $1.65 |
| Q2 2025 | $1.81 |
| Q3 2025 | $1.61 |
| Q1 2026 | $1.73 |
| Q2 2026 | $1.75 |
| Q3 2026 | $1.70 |
Fourth-quarter EPS appears once the press release is read; filings report it only for the full year.
Data
| Q4 2024 | 43.0% |
| Q1 2025 | 43.8% |
| Q2 2025 | 45.9% |
| Q3 2025 | 45.0% |
| Q4 2025 | 40.3% |
| Q1 2026 | 45.0% |
| Q2 2026 | 45.1% |
| Q3 2026 | 45.2% |
Data
| Q4 2024 | $200.0M |
| Q1 2025 | $391.0M |
| Q2 2025 | $188.7M |
| Q3 2025 | $336.1M |
| Q4 2025 | $276.1M |
| Q1 2026 | $326.4M |
| Q2 2026 | $297.9M |
| Q3 2026 | $200.0M |
Operating cash flow minus capital expenditure, from cash flow statements.
Questions
What AI products did Verisk launch this quarter?
Verisk launched MCP Connectors with Microsoft and Amazon and made further content available via Claude in October. It also released the first quarterly update for Verisk Synergy Studio.
What is driving Verisk's subscription growth?
Clients are expanding and extending relationships across Forms, Rules & Loss Costs and Catastrophe Risk Solutions as they adopt new solutions. Strong renewals and new logos in Anti-Fraud also helped.
Which parts of Verisk's business are under pressure?
Property and Restoration Solutions saw below-average weather-related volumes, and transactional activity was softer in U.S. and Canada property lines. Stronger Life Solutions services partly offset this.
How is Verisk building its data assets?
It added 21 new data contributors to its E&S dataset and grew its image library in Digital Media Forensics by 200m images. It also released its 2026 Global Modeled Catastrophe Losses Report.
Did Verisk change its full-year outlook?
No. Verisk maintained its 2026 guidance, and management said the year is on track with its Investor Day targets.
Call recording
Call recording on YouTube ↗. Official replay ↗.