
Verisk (VRSK) · Exchanges & Data
Verisk Q2 2026 earnings: summary, key numbers & outlook
Results filed 29 Jul 2026 · Quarter ended 30 Jun 2026
Slides (22 pages)Official transcript (PDF) ↗Press release ↗Investor relations ↗
Summaries and transcripts are machine-generated and can contain errors.
In brief
Verisk launched two MCP connectors with Anthropic's Claude and bought McKenzie Intelligence Services, extending its insurance data into AI workflows and event response.
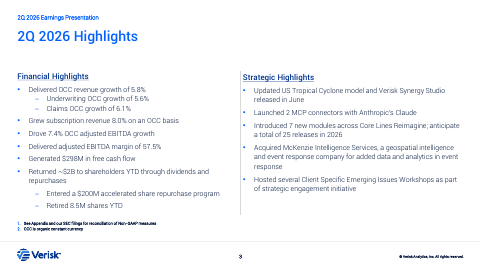
Verisk pushed its proprietary insurance data into AI tools this quarter. It launched 2 MCP connectors with Anthropic's Claude, released an updated US Tropical Cyclone model and Verisk Synergy Studio, and introduced 7 new modules across Core Lines Reimagine. It also acquired McKenzie Intelligence Services, a geospatial intelligence and event response company. Subscription revenue grew 8.0% on an organic constant currency basis, while transactional revenue fell 4.2%.
Management says it will keep investing in proprietary datasets and applying advanced AI to them, with 25 Core Lines Reimagine releases anticipated in 2026. The tension is that AI distribution is early and unproven at scale, while transactional volumes remain soft. Weather-related claims volumes, tough property underwriting comparisons, Middle East travel disruption and a government contract work stoppage all weighed on results. Management expects growth to return to Investor Day target levels in the second half.
No call transcript for this quarter, so this summary also draws on: The Motley Fool ↗.
Slides & documents
Open the slide deck (PDF, 22 pages) ↗

Showing the first 6 of 22 pages.
From Verisk investor relations
SEC filing
Key numbers
- Revenue · GAAP
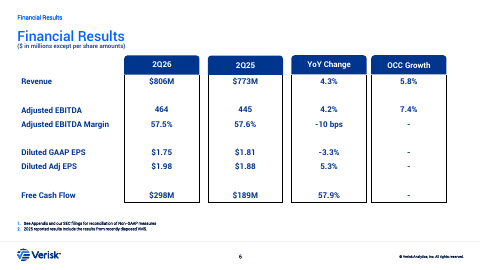
- $806 million
- Net income · GAAP
- $229 million
- Diluted EPS · GAAP
- $1.75
- Diluted adjusted EPS · non-GAAP
- $1.98
- Net cash provided by operating activities · GAAP
- $366 million
- Free cash flow · non-GAAP
- $298 million
- Adjusted EBITDA · non-GAAP
- $464 million
up 4.3% from a year ago
down 9.8% from a year ago
down 3.3% from a year ago
up 5.3% from a year ago
up 49.7% from a year ago
up 57.9% from a year ago
up 4.2% from a year ago
| Segment or metric | Value | Change |
|---|---|---|
| Underwriting revenue | $569.0M | up 3.5% reported, 5.6% OCC |
| Claims revenue | 237.0M | up 6.3% reported, 6.1% OCC |
| Transactional revenue growth (OCC) | -4.2% |
Where each number comes from
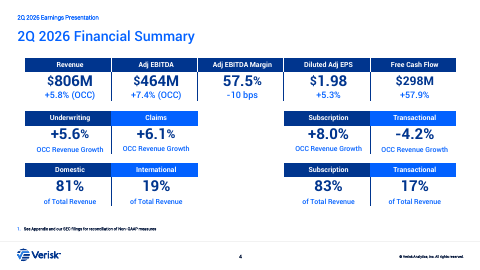
- Revenue: “Revenue was $806 million, up 4.3%, and up 5.8% on an organic constant currency (OCC) basis, a non-GAAP measure.”
- Net income: “Net income was $229 million, down 9.8%.”
- Diluted EPS: “Diluted GAAP earnings per share (EPS) was $1.75, down 3.3%.”
- Diluted adjusted EPS: “Diluted adjusted EPS, a non-GAAP measure, was $1.98, up 5.3%.”
- Net cash provided by operating activities: “Net cash provided by operating activities was $366 million, up 49.7% and free cash flow, a non-GAAP measure, was $298 million, up 57.9%.”
- Free cash flow: “Net cash provided by operating activities was $366 million, up 49.7% and free cash flow, a non-GAAP measure, was $298 million, up 57.9%.”
- Adjusted EBITDA: “Adjusted EBITDA, a non-GAAP measure, was $464 million, up 4.2%, and up 7.4% on an OCC basis.”
- Underwriting revenue: “Underwriting | $569 | $550 | 3.5% | 5.6% Claims | 237 | 223 | 6.3 | 6.1 Insurance | $806 | $773 | 4.3 | 5.8”
- Claims revenue: “Underwriting | $569 | $550 | 3.5% | 5.6% Claims | 237 | 223 | 6.3 | 6.1 Insurance | $806 | $773 | 4.3 | 5.8”
- Transactional revenue growth (OCC): “Underwriting Claims Subscription Transactional +5.6% +6.1% +8.0% -4.2% OCC Revenue Growth”
Copied from the press release ↗ and other documents in the SEC filing ↗. A figure is published only if its sentence is in those documents.
| From the filing | Q2 2026 | vs year ago | vs last quarter |
|---|---|---|---|
| Revenue | $806.3M | +4.4% | +3.0% |
| Operating income | $363.7M | +2.7% | +3.3% |
| Net income | $228.6M | −9.8% | −2.4% |
| Diluted EPS | $1.75 | −3.3% | +1.2% |
| Free cash flow | $297.9M | +57.9% | −8.7% |
| Operating margin | 45.1% | −0.8 pts | +0.1 pts |
Calculated by code from XBRL, not by the model.
Outlook
| Metric | Period | Outlook |
|---|---|---|
| Total revenue | Full Year 2026 | $3,190 to $3,240 million |
| Adjusted EBITDA | Full Year 2026 | $1,790 to $1,830 million |
| Adjusted EBITDA margin | Full Year 2026 | 56.0% to 56.5% |
| Diluted adjusted EPS | Full Year 2026 | $7.45 to $7.75 |
| Tax rate | Full Year 2026 | 23.0% to 26.0% |
| Capital expenditures | Full Year 2026 | $260 to $280 million |
Key takeaways
Verisk launched two MCP connectors with Claude
The presentation lists 2 MCP connectors with Anthropic's Claude as a strategic highlight. Verisk's data and analytics can now be reached inside client AI workflows.
McKenzie Intelligence Services adds event response data
Verisk acquired the geospatial intelligence and event response company for added data and analytics in event response. It will become part of Verisk Catastrophe and Risk Solutions.
Product releases continue across catastrophe and core lines
An updated US Tropical Cyclone model and Verisk Synergy Studio shipped in June. Verisk also introduced 7 new modules across Core Lines Reimagine and anticipates 25 releases in 2026.
Subscription demand is strong, transactional is weak
Subscription revenue grew 8.0% OCC on price realization, renewals, and new client wins in catastrophe and risk. Transactional revenue declined 4.2% on lower weather-related volumes, tough property comparisons and reduced travel volumes.
Claims growth rebounded on anti-fraud and property
Claims revenue grew 6.1% OCC, driven by anti-fraud analytics and property and restoration solutions. This was up from 3.4% in the prior quarter.
Charts
Fourth quarter worked out from the annual figure.
Data
| Q4 2024 | $735.6M * |
| Q1 2025 | $753.0M |
| Q2 2025 | $772.6M |
| Q3 2025 | $768.3M |
| Q4 2025 | $778.8M * |
| Q1 2026 | $782.6M |
| Q2 2026 | $806.3M |
| Q3 2026 | $809.0M |
Data
| Q1 2025 | $1.65 |
| Q2 2025 | $1.81 |
| Q3 2025 | $1.61 |
| Q1 2026 | $1.73 |
| Q2 2026 | $1.75 |
| Q3 2026 | $1.70 |
Fourth-quarter EPS appears once the press release is read; filings report it only for the full year.
Data
| Q4 2024 | 43.0% |
| Q1 2025 | 43.8% |
| Q2 2025 | 45.9% |
| Q3 2025 | 45.0% |
| Q4 2025 | 40.3% |
| Q1 2026 | 45.0% |
| Q2 2026 | 45.1% |
| Q3 2026 | 45.2% |
Data
| Q4 2024 | $200.0M |
| Q1 2025 | $391.0M |
| Q2 2025 | $188.7M |
| Q3 2025 | $336.1M |
| Q4 2025 | $276.1M |
| Q1 2026 | $326.4M |
| Q2 2026 | $297.9M |
| Q3 2026 | $200.0M |
Operating cash flow minus capital expenditure, from cash flow statements.
Questions
What did Verisk launch with Anthropic?
Verisk launched 2 MCP connectors with Anthropic's Claude, which the presentation lists as a strategic highlight for the quarter.
What did Verisk acquire this quarter?
Verisk acquired McKenzie Intelligence Services, a geospatial intelligence and event response company, to add data and analytics for event response.
What drove underwriting growth?
Underwriting grew 5.6% on an OCC basis, helped by annual price increases from model and content enhancements in forms, rules and loss costs, plus expanded catastrophe and risk solutions sold to new and existing customers.
Why did transactional revenue decline?
Transactional revenue fell 4.2% on lower weather-related volumes in Property and Restoration Solutions, tough comparisons from last year's property underwriting overages, and lower travel volumes tied to Middle East travel disruption.
What is Verisk's outlook for growth?
Verisk reaffirmed its 2026 outlook. Management expects growth in the second half to return to levels consistent with its Investor Day targets.