
Travelers (TRV) · Insurance
Travelers Q2 2026 earnings: summary, key numbers & outlook
Results filed 17 Jul 2026 · Quarter ended 30 Jun 2026
Slides (24 pages)Official transcript (PDF) ↗Press release ↗Investor relations ↗
Summaries and transcripts are machine-generated and can contain errors.
In brief
Travelers held price discipline across commercial lines while Surety and Middle Market drove growth and Personal Insurance shrank as auto and home pricing cooled.
Commercial and specialty demand was strong. Business Insurance new business hit a record $805 million, Middle Market grew 7% and retention held at 86%. Bond & Specialty grew on a 40% jump in Surety, helped by large projects. Personal Insurance shrank, with auto and homeowners policies in force both down year over year, though homeowners new business rose to $260 million.
Management is steering toward profitable franchise value rather than volume, passing on business where price and terms don't fit the risk. It plans to keep investing in technology, including AI, and in the BOP 2.0 small business product. The main tension is pricing: commercial renewal increases are slowing, auto renewal pricing is flat, and shrinking personal books pressure growth.
No call transcript for this quarter, so this summary also draws on: Benzinga (via Webull) ↗, Benzinga (via CEOInterviews.AI) ↗.
Slides & documents
Open the slide deck (PDF, 24 pages) ↗

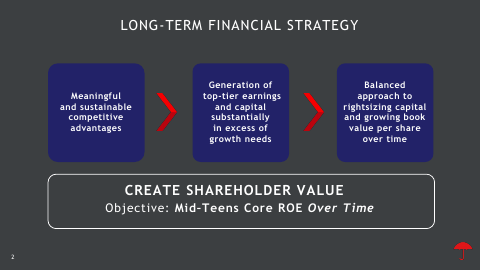
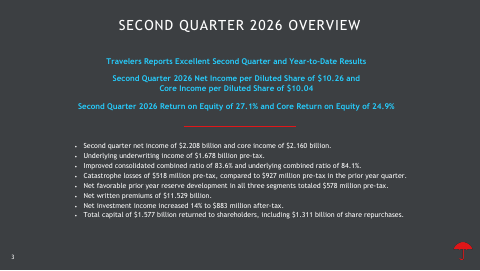
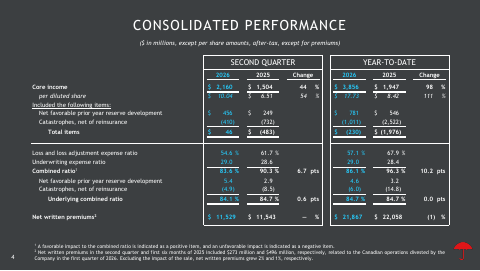
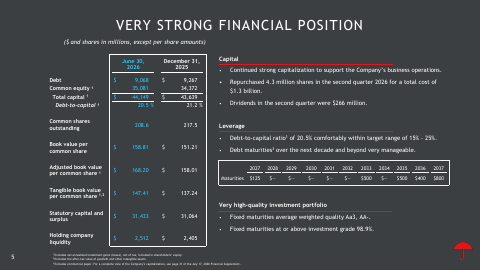
Showing the first 6 of 24 pages.
From Travelers investor relations
- TranscriptCompany's official transcript ↗
- WebcastWebcast replay ↗
- Statistical SupplementFinancial tables ↗
- Form 10-QDocument ↗
SEC filing
Key numbers
- Net income · GAAP
- $2.208 billion
- Net income per diluted share · GAAP
- $10.26
- Core income per diluted share · non-GAAP
- $10.04
- Total revenues · GAAP
- $12.2B
- Combined ratio
- 83.6%
- Core return on equity · non-GAAP
- 24.9%
up from $1.509 billion in the prior year quarter
up from $6.53 in the prior year quarter
up from $6.51 in the prior year quarter
comparable to $12,116 million in the prior year quarter
improved 6.7 points from 90.3%
up from 18.8% a year ago
| Segment or metric | Value | Change |
|---|---|---|
| Business Insurance net written premiums | $6.0B | up 3% |
| Bond & Specialty Insurance net written premiums | $1.2B | up 14% |
| Personal Insurance net written premiums | $4.3B | down 8% |
| Surety net written premiums | $480.0M | up 40% |
| Middle Market net written premiums | $3.2B | up 7% |
| Domestic Business Insurance new business | $805 million | up 8% |
| Personal auto policies in force | 2,801 thousand | down 3% year over year |
Where each number comes from
- Net income: “The Travelers Companies, Inc. today reported net income of $2.208 billion, or $10.26 per diluted share, for the quarter ended June 30, 2026”
- Net income per diluted share: “reported net income of $2.208 billion, or $10.26 per diluted share, for the quarter ended June 30, 2026, compared to $1.509 billion, or $6.53 per diluted share”
- Core income per diluted share: “Core income in the current quarter was $2.160 billion, or $10.04 per diluted share, compared to $1.504 billion, or $6.51 per diluted share, in the prior year quarter.”
- Total revenues: “Net written premiums | $11,529 | $11,543 | —% | $21,867 | $22,058 | (1)% Total revenues | $12,153 | $12,116 | —”
- Combined ratio: “The combined ratio improved to 83.6%, and the underlying combined ratio improved to 84.1% driven by a lower underlying loss ratio.”
- Core return on equity: “Second Quarter 2026 Return on Equity of 27.1% and Core Return on Equity of 24.9%”
- Business Insurance net written premiums: “Business Insurance | $5,984 | $5,792 | 3% | $11,770 | $11,490 | 2%”
- Bond & Specialty Insurance net written premiums: “Bond & Specialty Insurance | 1,237 | 1,085 | 14 | 2,303 | 2,084 | 11”
- Personal Insurance net written premiums: “Personal Insurance | 4,308 | 4,666 | (8) | 7,794 | 8,484 | (8)”
- Surety net written premiums: “Surety | 480 | 342 | 40 | 861 | 675 | 28”
- Middle Market net written premiums: “Middle Market | 3,235 | 3,034 | 7 | 6,564 | 6,200 | 6”
- Domestic Business Insurance new business: “Retention remained very strong at 86%, and new business was a record $805 million, up 8% over the prior year quarter.”
- Personal auto policies in force: “Policies in force (in thousands) 2,902 2,880 2,858 2,842 2,819 2,801 • Sequential quarter growth (1%) (1%) (1%) (1%) (1%) (1%) • Year over year growth (3%)”
Copied from the press release ↗ and other documents in the SEC filing ↗. A figure is published only if its sentence is in those documents.
| From the filing | Q2 2026 | vs year ago | vs last quarter |
|---|---|---|---|
| Revenue | $12.2B | +0.3% | +1.9% |
| Net income | $2.2B | +46.3% | +29.0% |
| Diluted EPS | $10.26 | +57.1% | +31.9% |
Calculated by code from XBRL, not by the model.
Outlook
| Metric | Period | Outlook |
|---|---|---|
| Underwriting expense ratio | full year 2026 | approximately 28.5% |
Key takeaways
Business Insurance new business reached a record
New business in domestic Business Insurance was $805 million, up from $748 million a year earlier, while retention held at 86%. Demand is rising without loosening standards.
Surety growth drove Bond & Specialty expansion
Surety premiums rose 40% to $480 million, reflecting large projects and strong production across the portfolio. Management Liability retention improved to 88%.
Commercial renewal pricing is moderating steadily
Domestic Business Insurance renewal premium change slowed to 4.8% from 9.0% a year earlier, with Middle Market at 6.1% and Select Accounts at 9.4%. Growth now leans more on volume and new business.
Personal Insurance is shrinking as pricing cools
Auto renewal premium change fell to flat from 5.1% a year earlier, and policies in force declined 3% in auto and 5% in homeowners. Homeowners new business rose to $260 million.
Management is leaning on AI and BOP 2.0
Management says earnings scale lets it invest in differentiating technology, including AI. Its small business BOP 2.0 product uses industry-leading segmentation and generates quotes in seconds.
Charts
Fourth quarter worked out from the annual figure.
Data
| Q4 2024 | $12.0B * |
| Q1 2025 | $11.8B |
| Q2 2025 | $12.1B |
| Q3 2025 | $12.5B |
| Q4 2025 | $12.4B * |
| Q1 2026 | $11.9B |
| Q2 2026 | $12.2B |
| Q3 2026 | $12.4B |
Data
| Q1 2025 | $1.70 |
| Q2 2025 | $6.53 |
| Q3 2025 | $8.24 |
| Q1 2026 | $7.78 |
| Q2 2026 | $10.26 |
| Q3 2026 | $9.04 |
Fourth-quarter EPS appears once the press release is read; filings report it only for the full year.
Questions
Where is Travelers growing fastest?
Surety grew 40% to $480 million and Middle Market grew 7%. Business Insurance new business was a record $805 million.
Is Travelers competing on price?
No. Management says it prefers to compete on franchise value, matches price to risk and passes on business where price and terms don't fit.
What is happening in Personal Insurance?
Premiums fell 4% excluding the Canadian sale, with auto and homeowners policies in force down year over year. Auto renewal pricing was flat, while homeowners new business rose to $260 million.
How is Travelers using technology and AI?
Management says its scale lets it invest in differentiating technology, including AI, at a level that sets it apart. Its BOP 2.0 product uses sophisticated underwriting rules to generate quotes in seconds.
What changed in Travelers' portfolio and reinsurance this year?
Travelers divested its Canadian operations in the first quarter of 2026. It also placed a $750 million Long Point Re IV catastrophe bond, renewed Northeast catastrophe reinsurance, and did not renew its Personal Insurance catastrophe excess-of-loss treaty.