“With a backdrop of strong demand for AI servers, currently our customers keep asking to pull forward delivery timing and purchase additional systems.”
It shows demand is exceeding customers' original schedules, not just holding steady.

Tokyo Electron (8035) · Semiconductors
Results filed 30 Oct 2026 · Quarter ended 30 Sep 2026 · Company's own call transcript · Toshiki Kawai (CEO), Hiroshi Kawamoto (CFO)
Read the transcriptSlides (22 pages)Press release ↗Investor relations ↗
Summaries and transcripts are machine-generated and can contain errors.
Tokyo Electron's AI-driven memory and logic customers keep pulling deliveries forward, and it won its first DRAM conductor-etch process of record while lifting its 2027 market outlook to $210B+.
AI server demand is pushing customers to ask for earlier deliveries and extra systems. Tokyo Electron won its first process of record with conductor etch for DRAM capacitor masks, kept gaining orders for cryogenic NAND etch, and had a new single-wafer CVD tool well received for leading-edge logic contact metal. Prober shipments are expected to rise about 60%, and the Kumamoto coater/developer unit recovered quickly from the July 2026 earthquake.
Management is steering toward a wafer-fab-equipment market of about $160B in CY2026 and $210B+ in CY2027, adding capacity through a new Miyagi production center due in summer 2027. The main tension is supply: some parts need close management, and visibility through FY2028 is only expected to improve around the end of CY2026. Price optimization to pass on higher costs adds a second watch point.
Open the slide deck (PDF, 22 pages) ↗
Showing the first 6 of 22 pages.
From Tokyo Electron investor relations
Results documents
up 48.4% from a year ago
up 86.4% from a year ago
up 6.5 points from a year ago
up 2.6 points from a year ago
up 71.7% from a year ago
up from 105.12 a year ago
| Segment or metric | Value | Change |
|---|---|---|
| Field Solutions sales | 191.0 billion yen | up 1.6% from the previous quarter |
| Parts and services (Field Solutions) | 6.4% | up quarter over quarter, sixth consecutive quarter of growth |
| DRAM share of new equipment sales | 34% | DRAM sales up 45% from the previous quarter |
| China share of net sales | 36.4% | up 6 percentage points |
| SPE new equipment sales, first half | 1 trillion 265.7 billion yen |
Copied from the press release ↗ and other documents in the company's results page ↗. A figure is published only if its sentence is in those documents.
| Metric | Period | Outlook |
|---|---|---|
| Net sales | fiscal year ending March 2027 | 3 trillion 700 billion yen |
| Operating income | fiscal year ending March 2027 | 1 trillion 169 billion yen |
| Gross profit margin | fiscal year ending March 2027 | 47.9% |
| Gross profit margin | second half of FY2027 | 48.3% |
| Net income per share (post-split) | fiscal year ending March 2027 | 381.69 |
| R&D expenses | fiscal year ending March 2027 | 335 billion yen |
| Capital expenditures | fiscal year ending March 2027 | 190 billion yen |
| Full-year dividend per share | fiscal year ending March 2027 | 191 yen |
Tokyo Electron secured a process of record for DRAM capacitor mask etch, its first with conductor etch for DRAM, adding to its position in capacitor mold etch. Cryogenic NAND channel-hole etch orders are also progressing, with more inquiries for CY2027 and 2028.
Management said customers keep asking to pull forward delivery timing and buy extra systems because of AI server demand. It lifted its WFE outlook to about $160B for CY2026 and more than $210B for CY2027.
Prober shipments are expected to rise about 60%, supported by a clear No.1 share in advanced logic and a process of record for silicon photonics testing. Over 200 high-k batch ALD units for advanced packaging are expected to ship in both FY2027 and FY2028.
Management says capacity for second-half sales above 2 trillion yen is secured, and a new Miyagi Innovative Production Center for etch is due in summer 2027. Some parts need close management, with procurement visibility through FY2028 expected to improve around the end of CY2026 or early CY2027.
Management says it is passing on higher parts costs and expedited-delivery costs, and expects roughly half of the second-half margin gain to come from price optimization. It says this is not one-time and should contribute fully from FY2028.
Each quote matches the transcript word for word.
“With a backdrop of strong demand for AI servers, currently our customers keep asking to pull forward delivery timing and purchase additional systems.”
It shows demand is exceeding customers' original schedules, not just holding steady.
“This is our first POR with the conductor etch system for DRAM that we have strived to win for long time.”
It marks a long-sought entry into a new DRAM etch process, widening Tokyo Electron's etch footprint.
“Memory devices are now evolving from a “storage” function to a central key component to support AI performance.”
It explains management's thesis for why AI lifts demand for memory equipment such as DRAM and HBM.
“By capturing growing test demand, we expect about 60% year-over-year increase in prober shipment.”
It quantifies how rising test intensity is driving a second growth line beyond etch and deposition.
“This is a great example that we effectively leveraged overall resilience of our entire supply chain, which is one of our strengths.”
It frames the quick recovery from the Kumamoto earthquake as evidence of supply-chain resilience.
It won its first process of record with conductor etch for DRAM capacitor masks, saw growing orders for cryogenic NAND etch, and said its new single-wafer CVD tool is well received for leading-edge logic contact metal. It also won a process of record for silicon photonics wafer-level testing.
AI servers, including generative and agentic AI, are lifting demand for GPUs, HBM, CPUs, DRAM and NAND. Management says customers keep asking to pull forward deliveries and buy additional systems.
It now expects about $160B in CY2026 and more than $210B in CY2027, both roughly 30% growth. The 2027 figure aggregates customer investment plans, and it said current inquiries could push it higher.
Management says it has secured capacity for second-half sales above 2 trillion yen and plans a new Miyagi production center for summer 2027. It flagged that some parts need close management, with visibility through FY2028 expected to improve around the end of CY2026 or early CY2027.
It is passing through higher parts costs and costs of accelerated delivery, and calls this price optimization an ongoing practice. Roughly half of the expected second-half margin improvement comes from it, with a full contribution expected from FY2028.
Q2 FY2027 (July - September 2026) Financial Announcement
Magenta October 30, 2026 B 132 Agenda: Purple Consolidated Financial Summary Hiroshi Kawamoto, SVP & GM, CFO B 167 Business Environment and Financial Estimates Turquoise Toshiki Kawai, Representative Director, President & CEO
G 106 Investor Relations / October 30, 2026 1
Forward Looking Statements
R 244 ▪ Disclaimer regarding forward-looking statements Forward-looking statements with respect to Tokyo Electron's business plan, prospects and other such information are based on information available at the time of publication. Actual performance and results may differ significantly R 255 from the business plan described here due to changes in various external and internal factors, including political and B 255 economic situations, semiconductor market conditions, intensification of sales competition, safety and product quality Magenta management, intellectual property-related matters and impacts from infectious diseases. ▪ Processing of numbers For the amount listed, because fractions are rounded down, there may be the cases where the total for certain R 128 account titles does not correspond to the sum of the respective figures for account titles. Percentages are calculated B 167 using full amounts, before rounding. ▪ Foreign exchange rate fluctuations: In principle, export sales of Tokyo Electron's products are denominated in yen, although some sales and expenses are denominated in foreign currencies. Significant fluctuations in foreign exchange rates due to factors such as R 120 economic conditions in individual countries and regions, international developments, and changes in interest rates B 32 may affect the business performance of the Tokyo Electron Group.
G 106 Investor Relations / October 30, 2026 2
Q2 FY2027 Consolidated Financial Summary
Magenta October 30, 2026 Hiroshi Kawamoto R 128 SVP & GM, CFO
G 106 Investor Relations / October 30, 2026 3
Good afternoon. I am Kawamoto. I would like to present the consolidated financial summary of the second quarter of the fiscal year ending March 2027.
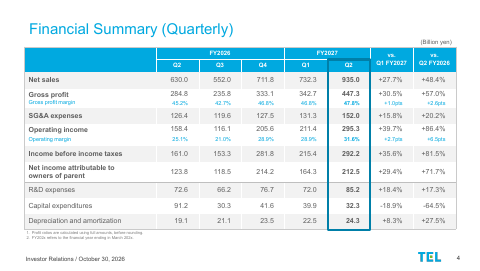
Financial Summary (Quarterly) G 45 (Billion yen) FY2026 FY2027 vs. vs. R 244 Q2 Q3 Q4 Q1 Q2 Q1 FY2027 Q2 FY2026 Net sales 630.0 552.0 711.8 732.3 935.0 +27.7% +48.4% G 255 Gross profit 284.8 235.8 333.1 342.7 447.3 +30.5% +57.0% B 255 Gross profit margin 45.2% 42.7% 46.8% 46.8% 47.8% +1.0pts +2.6pts SG&A expenses 126.4 119.6 127.5 131.3 152.0 +15.8% +20.2% B 132 Operating income 158.4 116.1 205.6 211.4 295.3 +39.7% +86.4% Purple Operating margin 25.1% 21.0% 28.9% 28.9% 31.6% +2.7pts +6.5pts B 167 Income before income taxes 161.0 153.3 281.8 215.4 292.2 +35.6% +81.5% Net income attributable to R0 123.8 118.5 214.2 164.3 212.5 +29.4% +71.7% G 178 owners of parent
Green R&D expenses 72.6 66.2 76.7 72.0 85.2 +18.4% +17.3% G 190 Capital expenditures 91.2 30.3 41.6 39.9 32.3 -18.9% -64.5%
Yellow Depreciation and amortization 19.1 21.1 23.5 22.5 24.3 +8.3% +27.5% G 220 1. Profit ratios are calculated using full amounts, before rounding. B0 2. FY202x refers to the financial year ending in March 202x.
G 106 Investor Relations / October 30, 2026 4
This slide shows the quarterly financial summary. I will mainly refer to the figures in the blue box. In the second quarter, with a backdrop of active market conditions, we generated net sales of 935.0 billion yen, 27.7% increase quarter over quarter, hitting a record high. Gross profit was 447.3 billion yen, 30.5% rise from the previous quarter. Gross profit margin was 47.8%, 1.0-percentage-point increase quarter over quarter, as fixed costs to sales ratio dropped along with the increase of net sales. Operating income was 295.3 billion yen, 39.7% increase from the previous quarter. Operating profit margin was 31.6%, increasing by 2.7 percentage points quarter over Income before income taxes grew by 35.6% to 292.2 billion yen. Net income attributable to owners of parent was 212.5 billion yen, 29.4% increase quarter over Capital expenditures in the second quarter were 32.3 billion yen.
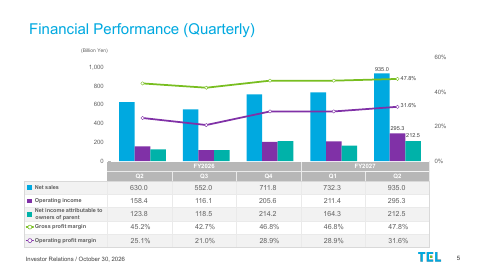
Financial Performance (Quarterly) (Billion Yen) Light Gray 60% G 244 1,000 935.0 47.8% White 800 R 255 40% 600 31.6% G 24 400 B 132 295.3 20% 212.5 0 0% Turquoise FY2026 FY2027 G 178 Q2 Q3 Q4 Q1 Q2 Net sales 630.0 552.0 711.8 732.3 935.0 Operating income 158.4 116.1 205.6 211.4 295.3 B 32 Net income attributable to owners of parent 123.8 118.5 214.2 164.3 212.5 R 238 Gross profit margin 45.2% 42.7% 46.8% 46.8% 47.8% Operating profit margin 25.1% 21.0% 28.9% 28.9% 31.6% G 106 Investor Relations / October 30, 2026 5
This is a graphic representation of the financial summary shown on the previous page on the chronological basis, for your reference.
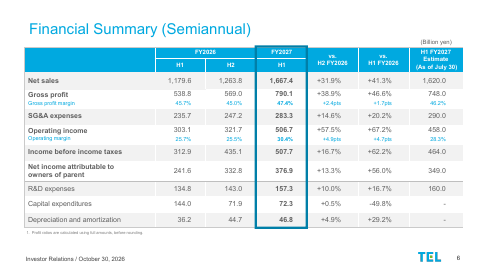
Financial Summary (Semiannual) G 45 (Billion yen) FY2026 FY2027 H1 FY2027 Light Gray vs. vs. Estimate R 244 H1 H2 H1 H2 FY2026 H1 FY2026 G 244 (As of July 30)
Net sales 1,179.6 1,263.8 1,667.4 +31.9% +41.3% 1,620.0 G 255 Gross profit 538.8 569.0 790.1 +38.9% +46.6% 748.0 B 255 Gross profit margin 45.7% 45.0% 47.4% +2.4pts +1.7pts 46.2% R 218 SG&A expenses 235.7 247.2 283.3 +14.6% +20.2% 290.0 B 132 303.1 321.7 506.7 +57.5% +67.2% 458.0 Operating income Purple Operating margin 25.7% 25.5% 30.4% +4.9pts +4.7pts 28.3% Income before income taxes 312.9 435.1 507.7 +16.7% +62.2% 464.0 Turquoise Net income attributable to R0 241.6 332.8 376.9 +13.3% +56.0% 349.0 G 178 owners of parent
R&D expenses 134.8 143.0 157.3 +10.0% +16.7% 160.0 G 190 Capital expenditures 144.0 71.9 72.3 +0.5% -49.8% -
Yellow Depreciation and amortization 36.2 44.7 46.8 +4.9% +29.2% - G 220 1. Profit ratios are calculated using full amounts, before rounding.
G 106 Investor Relations / October 30, 2026 6
This shows half-year-based financial summary. The figures in the blue box are the results of the first half of this fiscal year. On the half-year basis, net sales, gross profit, operating income, operating profit margin, and net income reached all-time highs. The rightmost column shows our guidance for the first half of this fiscal year announced on July 30.
As you can see, we have beaten these estimates in every item.
Composition of Net Sales by Region (Quarterly) (Billion yen) 1,000 935.0 G 244 7.7% Japan 800 8.2% North America White 711.8 732.3 4.5% Europe R 255 654.5 655.4 630.0 8.8% 11.6% 20.4% South Korea B 255 600 566.5 6.9% 8.1% 549.5 8.4% 552.0 8.0% 8.1% 3.3% 8.8% 7.1% 6.1% 4.2% 9.3% 2.4% 3.1% 11.7% 1.7% 7.1% Magenta 5.1% 20.8% 14.1% 17.5% 22.4% 7.9% 21.1% 2.3% 24.3% 19.3% Taiwan 4.2% 2.6% R 218 400 27.1% G 24 14.1% 18.3% 16.1% 19.0% 25.4% 3.5% Southeast Asia, B 132 20.7% Others 13.3% 3.4% 20.3% 22.0% 3.7% 4.3% 3.4% 20.3% 2.8% 3.2% Purple 200 6.3% 3.1% 36.4% China 41.3% 42.7% 40.3% G 49 34.3% 38.6% 31.8% 26.8% 30.4% Turquoise 2Q FY2025 3Q 4Q 1Q 2Q FY2026 3Q 4Q 1Q FY2027 2Q R0 Q2 Q3 Q4 Q1 Q2 Q3 Q4 Q1 Q2 B 169 52.6 45.3 53.4 64.3 52.9 39.3 82.8 64.6 72.2 Japan Green North America 79.9 57.7 46.2 43.4 38.4 27.8 56.7 59.0 76.6 R 120 Europe 23.8 15.7 20.3 14.0 10.8 12.7 29.7 24.2 41.7 B 32 South Korea 79.5 114.5 147.0 88.3 132.5 149.7 173.1 152.4 190.7 Yellow Taiwan 75.3 119.3 135.8 111.5 119.7 111.9 156.5 186.1 180.4 R 238 Southeast Asia, Others 21.2 22.3 27.8 15.6 21.3 34.8 22.1 22.9 33.2 B0 China 233.9 279.4 224.6 212.1 254.1 175.5 190.7 222.9 339.9 G 106 Investor Relations / October 30, 2026 7
This slide shows net sales by region. Sales in Korea and Taiwan remained strong. For China, due to the active investment of major customers, proportion of China rose by 6 percentage points to 36.4%. As we said in the first-quarter financial announcement in July, on the full-year basis, proportion of sales to China is expected to be low-30s% in fiscal year ending March 2027.
SPE New Equipment Sales by Application (Quarterly)
(Billion yen) DRAM 734.4 QoQ +38% Non-volatile memory White 700 Non-memory (Logic, foundry, others) G 255 22% B 255 600 34% QoQ +45% 540.1 17% 531.3 Magenta 510.6 503.9 25% R 218 12% G 24 500 455.0 22% 16% 17% 34% 27% 415.0 32% 10% QoQ +27% 29% 35% 395.0 12% 385.1 37% 40% 27% 31% 26% 16% 27% 24% 35% G 49 25% 26% 31% 8% 40% 11% 300 3% 20% 8% 38% 18% 36% 12% 14% 24% Turquoise 25% 10% 38% 23% 18% 27% 31% 32% 8% 16% 8% G 178 200 23% 17% 27% 34% 56% QoQ +36% B 169 30% 17% 31% 32% 34% 16% 71% 57% 27% 58% 57% Green 27% 51% 22% 64% 32% 59% 100 22% 32% 56% 32% 25% 24% 24% 27% 27% 21% 25% 23% 25% 26% 26% B 32 25% 23% 19% 19% Yellow 0 Q2 Q3 Q4 Q1 Q2 Q3 Q4 Q1 Q2 R 238 FY2025 FY2026 FY2027 B0 1. SPE: Semiconductor Production Equipment 2. Percentages on the graph show the composition ratio of new equipment sales. Field Solutions sales are not included. G 106 Investor Relations / October 30, 2026 8
This shows SPE new equipment sales by application. In the second quarter, from the top of this chart, sales to DRAM customers accounted for 34%, non-volatile memory accounted for 10%, and non-memory accounted for 56%. As you can see on the right of this chart, in all applications, quarter-over-quarter growth was recorded. In particular, sales to DRAM customers recorded significant sequential growth of 45%.
Field Solutions Sales (Quarterly)
(Billion yen) G 244 Used equipment and modification B 244 200 Parts and services 188.0 191.0 160.3 161.6 162.8 G 255 46.6 B 255 52.3 Magenta 150 139.5 141.5 138.9 141.2 R 218 45.8 43.4 G 24 58.2 B 132 38.9 42.9 42.1 42.5 R 128 100
Turquoise 144.3 135.7 R0 119.4 G 178 115.7 B 169 50 96.6 102.6 96.8 98.7 102.1
Yellow 0 Q2 Q3 Q4 Q1 Q2 Q3 Q4 Q1 Q2 R 238 FY2025 FY2026 FY2027
G 106 Investor Relations / October 30, 2026 9
This slide shows the Field Solutions sales. In the second quarter, Field Solution sales were 191.0 billion yen, growing by 1.6% from the previous quarter. Since customers' needs to maintain high utilization rate of their fabs remained strong, parts & services sales rose by 6.4% quarter over quarter, recoding sixth- consecutive- quarter growth, to support the entire Field Solution business growth.
Balance Sheet (Quarterly)
Assets Liabilities and Net Assets (Billion Yen) 3,177.4 (Billion Yen) 3,177.4 2,955.4 2,955.4 R 255 2,860.9 2,860.9 G 255 579.7 Cash and cash equivalents* 2,667.0 2,635.0 409.6 2,667.0 2,635.0 B 255 982.8 Liabilities 506.2 812.5 Magenta 455.2 418.4 Notes and accounts 791.0 R 218 544.0 619.0 receivable (trade, and 662.3 629.7 G 24 525.8 contract assets) B 132 411.4 401.5 R 128 751.5 747.4 Inventories G 49 720.4 725.3 713.1 97.7 107.6 Other current assets Turquoise 85.4 90.4 90.1 2,069.9 2,142.9 2,194.6 Net assets 2,004.6 2,005.2 R0 610.3 623.8 Tangible assets G 178 561.2 573.9 589.3 38.7 40.7 Intangible assets Green 35.7 36.4 37.5 397.4 388.8 398.6 503.2 458.8 Investment and other assets B 32 Q2 Q3 Q4 Q1 Q2 Q2 Q3 Q4 Q1 Q2 FY2026 FY2027 FY2026 FY2027 G 220 *Cash and cash equivalents: “Cash and deposits” + “Short-term investments”, etc. (“Securities” in Balance Sheet).
G 106 Investor Relations / October 30, 2026 10
This slide shows the balance sheet. Total assets were 3 trillion 177.4 billion yen. Cash and cash equivalents were 579.7 billion yen, increasing by 170.1 billion yen from the previous quarter. Notes and accounts receivable were 619.0 billion yen, increasing by 75.0 billion yen quarter over quarter. Inventories were 747.4 billion yen, declining by 4.0 billion yen quarter over quarter. As in the previous quarter, inventory turnover showed improvement. Tangible assets were 623.8 billion yen, increasing by 13.4 billion yen from the previous quarter. Investments and other assets were 458.8 billion yen, declining by 44.4 billion yen from the previous quarter, mainly due to fair market valuation of investment securities.
For the liabilities and net assets shown on the right-hand side, liabilities were 982.8 billion yen, increasing by 170.3 billion yen quarter over quarter, because of increased income taxes payable and provision for employees' bonus, both of which were coupled with our financial performance. Net assets were 2 trillion 194.6 billion yen, rising by 51.7 billion yen quarter over
Cash Flow (Quarterly) B 45 (Billion Yen)
Light Gray 400 351.1 G 244 300 310.4 G 255 100 Magenta -23.0 R 218 -40.6 -138.5 -100 -149.9 B 132 -46.9 -139.6 -11.4 -200 R 128 -300 Share Repurchase*2 -400 Turquoise FY2025 FY2026 FY2027 R0 Q2 Q3 Q4 Q1 Q2 Q3 Q4 Q1 Q2 B 169 Cash flow from operating activities 148.6 -15.0 264.8 74.9 175.8 83.1 205.7 118.7 351.1 Green Cash flow from investing activities*1 -54.4 -49.0 -38.9 -54.1 -86.7 1.2 33.2 -38.1 -40.6 G 190 Cash flow from financing activities -0.6 -170.1 -23.5 -151.1 -1.0 -122.3 -150.8 -178.4 -139.6 Free cash flow *3 94.1 -64.1 225.8 20.7 89.1 84.3 239.0 80.5 310.4 R 238 Cash on hand*4 525.5 295.5 496.2 367.5 455.2 418.4 506.2 409.6 579.7 G 220 *1 Cash flow from investing activities excludes changes in time deposits and short-term investments. *2 The amount for share repurchase excludes the cost incurred to purchase odd-lot shares. Orange *3 Free cash flow = “Cash flow from operating activities” + “Cash flow from investing activities” (excluding changes in “Time deposits” and “Short-term investments”). *4 Cash on hand includes “Cash and cash equivalents” + “Time deposits and short-term investments” with original maturities of more than three months. G 106 Investor Relations / October 30, 2026 11
This slide shows the cash flow. The cash inflow from operating activities in the second quarter was 351.1 billion yen. The cash outflow from investing activities was 40.6 billion yen. The cash outflow from financing activities was 139.6 billion yen mainly due to share buyback. Free cash flow was plus 310.4 billion yen. This concludes my presentation. Thank you very much.
Business Environment and Financial Estimates
Magenta October 30, 2026 Toshiki Kawai R 128 Representative Director, President & CEO
G 106 Investor Relations / October 30, 2026 12
This is Kawai. I will present “Business environment and financial estimates”.
Business Environment (WFE Market Outlook as of October 2026)
WFE Market Trend WFE Market Outlook B 244 ($B) AI Data Center Applications White Others (General-purpose Server, PC, ▪ CY2026: Approx. $160B R 255 200 Smartphone, Automotive, etc.) ▪ CY2027: $210B+ ▪ Adoption of generative and agentic AI accelerating demand for leading-edge chips Purple – GPU/HBM: Addressing increasing compute and data G 49 100 volumes – CPU: Growing demand for preprocessing, data delivery to GPUs and peripheral control B 169 50 – DRAM: Growing capacity needs for temporary data Green storage around CPUs/GPUs G 190 – NAND: More storage per server for AI models and B 32 0 large-scale data CY2023 CY2024 CY2025 CY2026 CY2027 G 220 Rising token volumes and compute complexity
driving chip demand across AI infrastructure G 106 Investor Relations / October 30, 2026 13
Let me start with the business environment. For WFE market, reflecting a very strong demand at present, we have revised the guidance we announced at the end of July, and now its size is expected to be around 160B dollars in CY2026 and more than 210B dollars in CY2027. In both years, around 30% year-over-year growth is expected. The AI evolution is further expanding growth opportunities of the entire semiconductor market. In addition to generative AI, along with spread of agentic AI, AI comes to autonomously implement multiple tasks, and accordingly the number of tokens is significantly increasing. As a result, GPU is required to feature higher computing capability, and HBM needs to feature more capacity and broader bandwidth to support Key Value cache. On top of that, demand for wide range of devices is emerging, including CPU for pre- processing and control, DRAM supporting long context, and NAND & SSD storing models, data and inference logs. In the past, computing performance enhancement was driven by processing power of logic devices such as CPU and GPU. But in the emerging AI era, the entire system performance is heavily dependent on not only how powerful processing is, but also how fast large amount of data can be stored and fed to GPUs. Accordingly, roles of memory devices such as DRAM and HBM are drastically changing. Memory devices are now evolving from a “storage” function to a central key component to support AI performance.
“More tokens, More semiconductors.”
As AI becomes more sophisticated, memory capacity and bandwidth as well as basic computing power increase further, which requires more semiconductor devices and more advanced technologies. This will lead to further growth of WFE market.
FY2027 Business Overview
▪ Record-high half-year performance driven by strong demand R 255 Net Sales Operating Income 1.6 trillion yen 506.7 billion yen (B yen) 1,667.4 (B yen) 506.7 G 24 500 B 132 1,500
Purple 400 G 49 1,000 300
Turquoise 200 G 178 100
Green 0 0 H1 H2 H1 H2 H1 H2 H1 H1 H2 H1 H2 H1 H2 H1 R 120 FY24 FY25 FY26 FY27 FY24 FY25 FY26 FY27
▪ Coater/Developer & Cleaning Systems BU: G 220 – Quick recovery from the Kumamoto earthquake
impact; H1 sales up over +50% vs. H2 FY2026 G 106 Investor Relations / October 30, 2026 14
Next, I will present the business overview of the first half of this fiscal year. Supported by very strong WFE demand, in the first half of this fiscal year, we generated net sales of 1 trillion 667.4 billion yen, delivering record high half-year net sales. In particular, sales generated by Business Unit of Coater/Developer and Cleaning System grew by more than 50% from the second half of fiscal year ended March 2026. This Business Unit is based in Kumamoto Plant in Kyushu, one of our core plants. They have succeeded in swift recovery from the impacts of the Kumamoto earthquake which took place in July 2026, achieving the remarkable results. This is a great example that we effectively leveraged overall resilience of our entire supply chain, which is one of our strengths. I would like to extend my heartfelt appreciation to all stakeholders for their dedicated cooperation.
FY2027 H1 Business & Product Progress
R 244 DRAM capacitor mask etch (conductor etch): B 244 1 POR*1 secured for the mask etch process in advanced generations, White Etch broad adoption in capacitor mold etch (dielectric etch) for current node G 255 NAND channel hole etch (dielectric etch): Steady progress in orders for cryogenic etch for volume production B 132 Contact metal deposition (single-wafer CVD): Purple Development POR secured for a new process in leading-edge logic Deposition Deep trench capacitor high-k deposition (batch ALD): Growing demand for advanced packaging; over 200 units expected to ship in both FY2027 and FY2028
No.1 market share in leading-edge logic: R 120 Record-high shipments expected (approx. +60% YoY) capturing growing B 32 Prober test demand Yellow Volume production ramping for integrated optical/electrical testing of G 220 PICs*2 1 POR: Process of Record Orange 2 PIC: Photonic Integrated Circuit
G 106 Investor Relations / October 30, 2026 15
This slide shows business and product progress in the first half of this fiscal year. In the first six months of this fiscal year, again, we made good progress in winning PORs in the leading-edge domains which will contribute to our future sales growth. For etching, in addition to the DRAM capacitor mold etch process where we already had high share, we won a POR in the capacitor mask etch process. This is our first POR with the conductor etch system for DRAM that we have strived to win for long time. We are making steady progress in receiving orders for cryogenic etch system for NAND channel hole in volume production lines. We are also receiving a lot of additional inquires toward CY2027 and 2028. Also for film deposition, we are making progress in various applications. For logic, our new product of single-wafer CVD is well received in contact metal and metal cap deposition processes for leading-edge-nodes. Sales are also growing for high-k batch ALD for deep trench capacitor used in advanced packaging. For prober, we have a clear No.1 share in advanced logic. By capturing growing test demand, we expect about 60% year-over-year increase in prober shipment. We are striving to further increase production volume. With regard to prober for silicon photonics, for which technologies to implement wafer-level integrated tests of photonics and electronics are essential, we have won POR by leveraging our wafer measurement technologies that we developed for advanced logic and expect contribution to our future sales.
通期の営業利益は1兆円の大台を超える
Financial Estimates for FY2027 B 45 (Billion Yen) Light Gray FY2027 R 244 FY2026 G 244 (Actual) H1 H2 Full Year B 244 vs FY2026 (Actual) (Estimates) (Estimates) R 255 Net sales 2,443.5 1,667.4 2,032.5 3,700.0 +51.4% Gross profit 1,107.8 790.1 981.8 1,772.0 +59.9% Magenta Gross profit margin 45.3% 47.4% 48.3% 47.9% +2.6pts G 24 SG&A expenses 482.9 283.3 319.6 603.0 +24.9% B 132 R&D 277.8 157.3 177.6 335.0 +20.6% Purple Other than R&D 205.0 125.9 142.0 268.0 +30.7% Operating income 624.9 506.7 662.2 1,169.0 +87.1% B 167 Operating margin 25.6% 30.4% 32.6% 31.6% +6.0pts Income before income taxes 748.1 507.7 664.2 1,172.0 +56.6% B 169 Net income attributable 574.4 376.9 488.0 865.0 +50.6% Green to owners of parent G 190 Net income per share (Yen) 250.91 166.13 381.69 +130.78 ▪ Tokyo Electron implemented a 5-for-1 common stock split on October 1, 2026. Yellow ▪ Net income per share is presented on the assumption that the stock split had been implemented at the beginning of FY2026. B0 Record-high sales, profits for full-year FY2027 G 106 Investor Relations / October 30, 2026 16
Next, I will present the financial estimates. With a backdrop of strong demand for AI servers, currently our customers keep asking to pull forward delivery timing and purchase additional systems. In the first half of this fiscal year, we hit record-high net sales, operating income and operating profit margin. In the second half, we expect to beat these records again. In the full-year FY2027, we expect net sales of 3 trillion 700 billion yen, gross profit of 1 trillion 772 billion yen and operating income of 1 trillion 169 billion yen. Operating income is expected to grow by 87% year-over-year, topping 1 trillion yen for the first time. Net sales in the second half of this fiscal year are expected to exceed 2 trillion yen, and we have secured sufficient production capacity for this level of sales.
FY2027 SPE New Equipment Sales Forecast
Sales by Application G 244 (Billion yen)
1,560.0 R 255 1,500 B 255 1,265.7 35% G 24 1,000 925.3 33% DRAM 850.1 Non-volatile memory 14% Non-memory 27% 35% 10% (Logic, foundry, others) G 49 12% 8% B 167 500 Turquoise 57% 51% R0 61% 57%
H1 FY2026 H2 FY2026 H1 FY2027 H2 FY2027 R 120 Estimate B 32 * Percentages on the graph show the composition ratio of new equipment sales. Field solutions sales are not included. G 220 H2 SPE New Equipment sales forecast at 1 trillion 560.0 billion yen
Full-year FY2027 SPE New Equipment sales forecast to grow +59% YoY G 106 Investor Relations / October 30, 2026 17
This slide shows SPE new equipment sales forecast. Actual sales in the first half of this fiscal year were 1 trillion 265.7 billion yen. In the second half, we expect new equipment sales of 1 trillion 560 billion yen. And on the full-year basis, we expect significant year-over-year growth of 59%. The breakdown by application is shown on this slide.
FY2027 R&D Expenses and Capex Plan (Billion yen) Rendering Light Gray 400 R&D expenses R 244 335.0 G 244 277.8 B 244 300 250.0 191.1 202.8 B 255 100 FY2023 FY2024 FY2025 FY2026 FY2027 B 132 Estimate
Purple Miyagi Innovative Production Center G 49 (Billion yen) B 167 Capex Depreciation 216.0 G 178 200 190.0 B 169 162.1 121.8 80.9 100.0 R 120 100 74.4 62.1 G 190 42.9 52.3
Yellow 0 FY2023 FY2024 FY2025 FY2026 FY2027 R 238 Estimate G 220 Taiwa-cho, Kurokawa-gun, Miyagi Prefecture Completion scheduled for summer 2027 G 106 Investor Relations / October 30, 2026 18
This slide shows our plan for R&D expenses and capex. In FY2027, we plan full-year R&D expenses of 335 billion yen. We will actively promote R&D to enhance the foundation of our technology competitive edge and support semiconductor technology innovation. For capex, we plan to spend 190 billion yen on the full year basis. In the previous fiscal year, construction was completed for the third development building in Miyagi, the process development building in Kumamoto, and Tohoku Production and Logistics Center in Iwate. Next summer, construction of Miyagi Innovative Production Center will be completed, which is expected to address drastic demand growth in the future. The picture on the bottom shows the current status. The construction is on track as planned.
FY2027 Dividend Forecast
G 244 Dividend per Share (Yen) White 191 R 255 200 (955) TEL shareholder return policy 150 125 Year-end R 218 118 (628) 108 Dividend payout ratio: 50% G 24 (592) B 132 (540) Annual DPS of not less than 10 yen* Purple 100 78 We will review our dividend policy if the company does not generate (393) R 128 net income for two consecutive fiscal years 50 Interim Turquoise 83 We will flexibly consider share buybacks R0 (415) G 178 *Due to the stock split on October 1, 2026, the amount has been changed from 50 yen to 10 yen. Green FY2024 FY2025 FY2026 FY2027 R 120 Estimate G 190 ▪ Tokyo Electron implemented a 5-for-1 common stock split on October 1, 2026. B 32 ▪ Dividends per share from FY2024 to FY2026, and interim dividend of FY2027 are presented on the assumption that the stock split had been implemented at the beginning of FY2024. ▪ Amounts without taking the stock split into account are shown in parentheses. B0 Full-year dividend estimated at a record-high 191 yen per share G 106 Investor Relations / October 30, 2026 19
Next, I will present the dividend forecast. Based on the full-year financial estimates that we announced today, FY2027 full-year dividend is expected to be record-high 191 yen per share. As announced on May 29, 2026, Tokyo Electron implemented a 5-for-1 common stock split on October 1, 2026. For your information, full-year dividend would be 955 yen per share if it were before the stock split.
Regarding Share Repurchase
Established share repurchase facility of up to 150B yen B 255 ◼ Type of shares to be Shares of common stock Magenta repurchased ◼ Total number of shares Up to 25 million shares to be acquired (Equivalent to 1.1% of outstanding shares excluding treasury stock)
◼ Total purchase amount for Up to 150 billion yen share repurchase
Green ◼ Period of repurchase From November 1, 2026 to March 31, 2027
G 220 TEL manages our balance sheet appropriately, considering our ability
to generate cash, necessary cash on hand and growth investment capital G 106 Investor Relations / October 30, 2026 20
Finally, in the Board of Directors meeting held today, we established share repurchase facility of up to 150 billion yen. This decision was made based on the comprehensive considerations of such factors as our ability to generate cash expected from our broadening business opportunities, and enhancement of cash position and capital efficiency. We will keep striving for appropriate balance sheet management. This concludes my presentation. Thank you very much for your kind attention.
Notice
You may not copy or disclose to any third party
without prior written consent with TEL.
Tokyo Electron
R 238 and “TEL” are trademarks of Tokyo Electron Limited.
G 106 Investor Relations / October 30, 2026 22