Summaries and transcripts are machine-generated and can contain errors.
In brief
Tokyo Electron raised its first-half outlook as AI-server demand brings pull-in requests and extra orders, and it expects second-half growth to be stronger still.
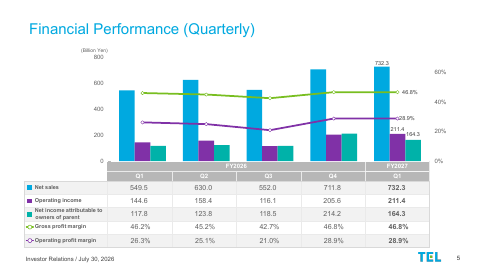
AI-server demand is pulling Tokyo Electron's customers forward. Management says customers are asking for earlier deliveries and placing additional orders. New-equipment sales to non-volatile memory customers rose 32% from the prior quarter, and Taiwan's share of sales rose to 25.4%. The new CLEAN TRACK LITHIUS Pro DICE coater/developer is ramping steadily, and customers are advancing process-of-record certification across several leading-edge logic and DRAM steps. Customers' fab utilization remains high, which lifted parts, services and modification sales.
Management is steering toward higher-value tools, AI and robotics-enabled service, faster equipment start-up, and price increases to offset inflation, aiming for a gross margin of 50% or more in about two years. The main tension is capacity and profitability. Management says it cannot yet supply a $300 billion wafer-fab-equipment market, and it calls the 35% operating-margin target in the current plan challenging. Geopolitics, export controls and supply chains are also being watched.
Net income attributable to owners of parent · GAAP
164,341 million yen
up 39.5% from a year ago
Diluted net income per share · GAAP
360.15 yen
Gross profit margin
46.8%
up 0.6 points from a year ago
Operating margin
28.9%
up 2.6 points from a year ago
Operating cash flow
118.7 billion yen
Free cash flow
80.5 billion yen
Segment or metric
Value
Change
Field Solutions sales
188.0 billion yen
up 15.5% sequentially
Parts and services sales
13.7%
growth from the previous quarter
Non-volatile memory new equipment sales
32%
increase quarter over quarter
Taiwan share of net sales
25.4%
Taiwan sales up 18.9% sequentially
China share of net sales
30.4%
up 3.6 percentage points quarter over quarter
Where each number comes from
Net sales: “net sales of 732,388 million yen (year-on-year growth of 33.3%), operating income of 211,407 million yen (year-on-year growth of 46.1%), ordinary income of 215,626 million yen”
Operating income: “net sales of 732,388 million yen (year-on-year growth of 33.3%), operating income of 211,407 million yen (year-on-year growth of 46.1%), ordinary income of 215,626 million yen”
Net income attributable to owners of parent: “ordinary income of 215,626 million yen (year-on-year growth of 46.3%), and net income attributable to owners of parent of 164,341 million yen (year-on-year growth of 39.5%)”
Diluted net income per share: “Net income per share of common stock (Yen): Basic 257.13 361.36 Diluted 256.49 360.15”
Gross profit margin: “Gross profit margin was 46.8%, remaining almost flat from the previous quarter.”
Operating margin: “Operating profit margin was 28.9%, almost unchanged from the previous quarter.”
Operating cash flow: “The cash inflow from operating activities in the first quarter was 118.7 billion yen. The cash outflow from investing activities was 38.1 billion yen.”
Free cash flow: “The cash outflow from financing activities was 178.4 billion yen primarily due to dividend payment. Free cash flow was plus 80.5 billion yen.”
Field Solutions sales: “In the first quarter, field solution sales increased by 15.5% sequentially to 188.0 billion yen.”
Parts and services sales: “parts and services sales grew by 13.7% from the previous quarter. Used equipment and modifications, including modifications for productivity enhancement, showed a particularly high growth rate of 20.5%”
Non-volatile memory new equipment sales: “In particular, sales to non-volatile memory customers increased by 32% quarter over quarter.”
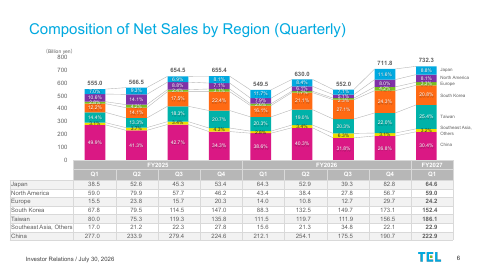
Taiwan share of net sales: “Sales in Taiwan increased by 18.9% sequentially, and its proportion went up to 25.4%.”
China share of net sales: “Proportion of sales in China was 30.4%, 3.6-percentage-point increase quarter over quarter.”
Management says customers are sending pull-in requests for delivery and additional orders. It expects second-half shipments of memory and advanced logic to grow faster than in the first half.
Wafer-fab-equipment demand now reaches CPUs and NAND
TEL puts the CY2026 market at $150B+ and CY2027 at $190B+, with AI data centers driving it. It says demand now covers DDR, CPU and 3D NAND as well as GPU and HBM.
New products are winning process-of-record slots
The CLEAN TRACK LITHIUS Pro DICE coater/developer is ramping steadily and process-of-record certification is advancing across several leading-edge logic and DRAM steps. TEL expects FY2027 coater/developer sales growth of 50%+ and etch growth of 25%+.
Price optimization and 50% gross margin are the profit plan
TEL plans higher-value tools, AI and robotics-enabled service, faster start-up and price increases to offset inflation. Price effects should begin in H2 FY2027 and show up in Q4, with a 50% gross margin targeted early in FY2028.
Capacity is the constraint behind the Miyagi plant
TEL says it cannot yet meet a $300 billion market. The Miyagi smart-fab center, due summer 2027, is meant to roughly triple etch production capacity.
What management said
Each quote matches the transcript word for word.
“AI data centers need a broad range of devices, not only GPU and HBM but also DDR, CPU and 3DNAND, and investment plans for advanced devices are accelerating.”
It shows AI demand is broadening across chip types, which widens TEL's addressable market.
“Shipment will increase furthermore, especially for memory and advanced logic applications, and we expect powerful growth momentum, stronger than that in the first half of this fiscal year.”
It signals management expects demand to accelerate further in the second half.
“Conventionally, the fab space limitation was regarded as a bottleneck. To overcome this challenge, quite a few large-scale fabs to manufacture leading-edge semiconductors are now being constructed.”
It explains why customers are building new fabs and why TEL stresses start-up speed.
What is driving Tokyo Electron's raised first-half outlook?
Management cites strong AI-server demand, with customers sending pull-in requests for delivery and additional orders. It expects second-half momentum to be stronger than the first half.
How big does TEL think the wafer-fab-equipment market will be?
TEL expects $150B+ in CY2026 and $190B+ in CY2027, with 20%+ growth each year. AI data center applications are expected to exceed 50% of the total.
How does TEL plan to improve profitability?
It plans higher-value next-generation tools and upgrades, AI and robotics-enabled service with Epsira, faster equipment start-up and price optimization. It aims for a gross margin of 50% or more in about two years, with price effects starting in H2 FY2027.
Can TEL supply a much larger market?
Management says it does not currently have the production capacity for a $300 billion market. The Miyagi Innovative Production Center, due summer 2027, is meant to roughly triple etch production capacity.
Which products does TEL expect to drive growth in FY2027?
It expects 50%+ growth in coaters/developers and 25%+ in etch, plus strong advanced-packaging and prober demand. Newer areas include cryogenic etch for 400-layer NAND and DRAM interconnect etch, where TEL now targets 1 trillion yen of cumulative sales through 2030.
B 255 July 30, 2026 Agenda: B 132 Consolidated Financial Summary Purple Hiroshi Kawamoto, SVP & GM, CFO, Division Officer of Finance Division Business Environment and Financial Estimates Toshiki Kawai, Representative Director, President & CEO
R 244 ▪ Disclaimer regarding forward-looking statements B 244 Forward-looking statements with respect to Tokyo Electron’s business plan, prospects and other such White information are based on information available at the time of publication. Actual performance and G 255 results may differ significantly from the business plan described here due to changes in various external and internal factors, including political and economic situations, semiconductor market conditions, R 218 intensification of sales competition, safety and product quality management, intellectual property-related B 132 matters and impacts from infectious diseases. R 128 ▪ Processing of numbers B 167 For the amount listed, because fractions are rounded down, there may be the cases where the total for Turquoise certain account titles does not correspond to the sum of the respective figures for account titles. G 178 Percentages are calculated using full amounts, before rounding.
expenses are denominated in foreign currencies, the impact of foreign exchange rate fluctuations on R 238 profits is negligible, unless extreme fluctuations occur.
Good afternoon. I am Kawamoto of Finance Division. I would like to present the consolidated financial summary of the first quarter of the fiscal year ending March 2027.
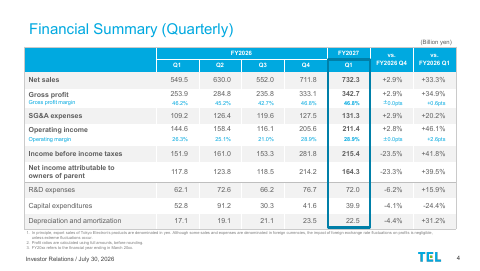
Yellow Depreciation and amortization 17.1 19.1 21.1 23.5 22.5 -4.4% +31.2% G 220 1. In principle, export sales of Tokyo Electron’s products are denominated in yen. Although some sales and expenses are denominated in foreign currencies, the impact of foreign exchange rate fluctuations on profits is negligible, B0 unless extreme fluctuations occur. 2. Profit ratios are calculated using full amounts, before rounding. Orange 3. FY20xx refers to the financial year ending in March 20xx. G 106 Investor Relations / July 30, 2026 4
▪ This slide shows the quarterly financial summary. I will mainly refer to the figures in the blue box. ▪ In the first quarter, we generated net sales of 732.3 billion yen, 2.9% increase quarter over quarter, reflecting our customers’ positive attitude toward investment. ▪ Accordingly, gross profit was 342.7 billion yen, 2.9% rise from the previous quarter. Both net sales and gross profit hit record high. ▪ Gross profit margin was 46.8%, remaining almost flat from the previous quarter. ▪ Operating income was 211.4 billion yen, increasing by 2.8% sequentially. Operating profit margin was 28.9%, almost unchanged from the previous quarter. Net income attributable to owners of parent dropped by 23.3% from the previous quarter to 164.3 billion yen. This is because, in the previous quarter, extraordinary income by selling strategic shareholdings was included.
▪ Sales in Taiwan increased by 18.9% sequentially, and its proportion went up to 25.4%. ▪ Proportion of sales in China was 30.4%, 3.6-percentage-point increase quarter over quarter. ▪ On the FY2027 full-year basis, proportion of sales in China is expected to be the low 30s% level.
▪ This shows SPE new equipment sales by application. ▪ In the first quarter, from the top of this chart, sales to DRAM customers accounted for 32%, non-volatile memory accounted for 11%, and non-memory accounted for 57%. ▪ SPE new equipment sales were strong just as in the previous quarter. In particular, sales to non-volatile memory customers increased by 32% quarter over quarter.
(Billion yen) G 244 Used equipment and modification B 244 200 Parts and services 188.0 G 255 160.3 161.6 162.8 B 255 52.3 Magenta 150 139.5 141.5 138.9 141.2 R 218 45.8 43.4 118.1 58.2 B 132 38.9 42.9 42.1 42.5 25.0 R 128 100
▪ This slide shows the Field Solutions sales. ▪ In the first quarter, field solution sales increased by 15.5% sequentially to 188.0 billion yen. ▪ Customers’ fab utilization remains at a high level, and parts and services sales grew by 13.7% from the previous quarter. Used equipment and modifications, including modifications for productivity enhancement, showed a particularly high growth rate of 20.5% from the previous quarter.
This slide shows the balance sheet. Total assets were 2 trillion 955.4 billion yen. Cash and cash equivalents were 409.6 billion yen, decreasing by 96.6 billion yen from the previous quarter, mainly due to dividend payment to our shareholders and tax payment. Notes and accounts receivable were 544.0 billion yen, increasing by 18.1 billion yen quarter over quarter. Inventories were 751.5 billion yen, increasing by 38.4 billion yen from the previous quarter. Although inventories increased, inventory turnover showed improvement. Tangible assets were 610.3 billion yen, increasing by 21.0 billion yen from the previous quarter. For the liabilities and net assets shown on the right-hand side, liabilities were 812.5 billion yen, increasing by 21.5 billion yen quarter over quarter. Net assets were 2 trillion 142.9 billion yen, rising by 72.9 billion yen sequentially.
This slide shows the cash flow. The cash inflow from operating activities in the first quarter was 118.7 billion yen. The cash outflow from investing activities was 38.1 billion yen. The cash outflow from financing activities was 178.4 billion yen primarily due to dividend payment. Free cash flow was plus 80.5 billion yen. This concludes my presentation. Thank you very much.
Light Gray WFE Market Trend WFE Market Outlook B 244 ($B) White AI Data Center Applications Others (General-purpose Server, PC, ▪ CY2026: $150B+ Smartphone, Automotive, etc.) ▪ CY2027: $190B+
▪ Demand for general-purpose memory /CPU is increasing as well B 167 100 as for GPU/HBM G 178 ▪ Investment plans for leading-edge B 169 50 Green chips are accelerating Yellow CY2023 CY2024 CY2025 CY2026 CY2027 WFE for AI data centers are growing to exceed 50% of total Orange With our strong position in advanced areas, our opportunities are expanding even further G 106 Investor Relations / July 30, 2026 12
▪ Let me start with the business environment. ▪ WFE market outlook has been updated from the April projection to 150 billion dollars or more in CY2026 and 190 billion dollars or more in CY2027. ▪ In both years, we expect 20% or more year-over-year growth. ▪ As shown in the diagram, sales for AI data center applications drive the WFE market. In five years from CY2023, which is the inaugural year of AI, through CY2027, sales to AI data center are expected to grow by five times or more. ▪ AI data centers need a broad range of devices, not only GPU and HBM but also DDR, CPU and 3DNAND, and investment plans for advanced devices are accelerating.
NAND 2yy-3xxL 4xxL Significant technological innovations are happening across devices as AI evolves * BSPDN (Backside Power Delivery Network) : Structures that arrange power delivery networks on the backside of silicon wafer G 106 Investor Relations / July 30, 2026 13
▪ This slide shows AI evolution and semiconductor technology trend. ▪ AI is evolving from current generative AI to full-fledged implementation of agentic AI and physical AI. ▪ For CPU and GPU, device scaling keeps going further from the current mainstream node of 3 nm while back-side PDN will be adopted to enhance power efficiency. ▪ DRAM is evolving from the 1c node to 1d node. For HBM, the number of stacked DRAMs will increase from 12 to 16. ▪ NAND will be evolving to 300 layers and further to 400 layers. ▪ These drastic technology innovations will be realized just within two years to come. ▪ Conventionally, the fab space limitation was regarded as a bottleneck. To overcome this challenge, quite a few large-scale fabs to manufacture leading-edge semiconductors are now being constructed.
While achieving our operating profit margin target remains challenging, Orange steady progress to date is putting operating profit of 1 trillion yen within reach G 106 Investor Relations / July 30, 2026 14
▪ Amid the rapid demand expansion and technology innovations that I described, Tokyo Electron has entered the final fiscal year of the mid-term management plan established in 2022. ▪ For net sales, as our outlook for the first half of this fiscal year exceeds 1.6 trillion yen and we receive stronger inquires in the second half, we are getting more confident to achieve 3 trillion yen or more. ▪ Also for ROE, we can expect 30% or more because of net income increase and capital efficiency improvement. ▪ Meanwhile, our business environment is changing more significantly than before. ▪ Export controls triggered by US-China trade conflict, tariffs, geopolitical impacts such as the Middle East conflicts and the prolonged Russia-Ukraine war, globally- spread inflation and exchange rate fluctuation, and changes in customers investment plans.....those emerging developments were not expected when we set up the mid-term management plan. ▪ These changes in our business environment make it challenging to achieve the goal of operating profit margin. For operating income, however, we are getting closer to achieve 1 trillion yen through our steady ongoing efforts.
▪ In order to achieve the goals of the mid-term management plan and pursue higher levels, it is critical to explore and enhance earning power and cope with changes in the market appropriately. ▪ We will launch high-value-added new models and upgrades in a timely manner. At the same time, we will enhance services by leveraging AI and robotics so that we can contribute to improvement of yield and equipment up-time ratio in our customers’ fabs. ▪ “Epsira ” that we announced in December 2025 is our digital infrastructure to raise field productivity. As we announced expansion of collaboration with NVIDIA this month, we are going to promote development of solutions for agentic AI and robotics ▪ As there are many plans for construction of large-scale fabs, in order to address scarcity of resources, it becomes critical to improve efficiency and reduce time of equipment start-up activities. ▪ We are exploring ways to further speed up equipment start-up activities, even from the equipment design phase, including introduction of automation. ▪ In addition, we will optimize pricing to address soaring costs triggered by recent inflation. ▪ By working on these initiatives, we aim to achieve gross profit margin of 50% or more within around two years to come.
FY2027 Update: Progress and Business Opportunities Ahead Business Progress Future Business Opportunities (FY2027 Sales Growth Drivers) (Highlights) ▪ Newly released CLEAN TRACK From POR to ▪ Cryogenic etch Sales Growth LITHIUS Pro DICE ramping steadily Coater/ Developer 50%+ ▪ POR*1 advancing across multiple High Volume ▪ Low-resistivity metal deposition Magenta YoY process steps in leading-edge Manufacturing ▪ Hybrid bonding R 218 logic/DRAM ▪ Full-year sales of 1T yen is within R 128 Sales Growth reach with accelerated investment in leading-edge logic/memory Cumulative ▪ DRAM interconnect etch: 1T yen B 167 Etch 25%+ Sales through Turquoise YoY ▪ Evaluations progressing with new 2030 ▪ Bonding-related equipment: 500B yen R0 model for DRAM HARC etch
Green ▪ In particular, our probers hold an ▪ Single wafer PECVD for gap fill: 10% of Sales Growth R 120 overwhelming position in high-end logic. New Entrants/ PECVD market Advanced 70%+ B 32 Expect to significantly exceed 100B SAM Packaging ▪ Device prober: 10-15% of prober market. Yellow yen for full year. Evaluations of new Expansion YoY Released Prexa SDP*2 R 238 model progressing well *1 POR (Process of Record): Certification of the adoption of equipment in customers' semiconductor production processes *2 SDP: Singulated Device Prober G 106 Investor Relations / July 30, 2026 16
Financial Estimates for H1 FY2027 B 45 (Billion Yen) Light Gray FY2027 FY2027 FY2026 G 244 (Actual) (Updated ▪ H1 FY2027: (Forecast Forecast) as of 4/30) H1 H2 Full Year H1 H1 Revised net sales upward to 1,620B R 255 yen due to customers’ robust G 255 Net sales 1,179.6 1,263.8 2,443.5 1,620.0 1,570.0 B 255 investment in leading-edge Gross profit 538.8 569.0 1,107.8 748.0 715.0 applications Gross profit margin 45.7% 45.0% 45.3% 46.2% 45.5% SG&A expenses 235.7 247.2 482.9 290.0 284.0 R&D 134.8 143.0 277.8 160.0 160.0 ▪ H2 FY2027: Other than R&D 100.8 104.1 205.0 130.0 124.0 B 167 Demand is expected to gain Turquoise Operating income 303.1 321.7 624.9 458.0 431.0 momentum further, raising R0 Operating margin 25.7% 25.5% 25.6% 28.3% 27.5% G 178 expectations for a significantly better B 169 Income before income Green taxes 312.9 435.1 748.1 464.0 437.0 performance in H2 Net income attributable 241.6 332.8 574.4 349.0 328.0 – Closely monitoring the impact of the B 32 to owners of parent Middle East and supply chain Yellow Net income per share (Yen) 527.31 1,254.57 767.51 721.12 developments
▪ Next, I will present the financial estimates. ▪ With a backdrop of strong demand for AI servers, currently, we are receiving pull-in request for delivery and additional orders from our customers. Reflecting our financial results of the first quarter and recent market dynamics, we have made upward revision to the financial estimate for the first half of this fiscal year. We expect net sales of 1 trillion 620 billion yen, gross profit of 748 billion yen and operating income of 458 billion yen, all of which are our half-year record.
▪ For the second half of FY2027, we expect another wave of acceleration in demand growth. ▪ Shipment will increase furthermore, especially for memory and advanced logic applications, and we expect powerful growth momentum, stronger than that in the first half of this fiscal year.
▪ For impacts of geopolitical context such as Middle East situation and supply chain status, there are not any issues to be noted but we will closely monitor the situation and take appropriate action.
Green 0 0 H1 FY2026 H2 FY2026 H1 FY2027 (E) Q1 FY2027 Q2 FY2027 R 120 (E) G 190 Updated Forecast Half-yearly Quarterly Yellow * Percentages on the graph show the composition ratio of new equipment sales. Field solutions sales are not included. Revised New Equipment sales upward to 1,240B yen Orange Q2 anticipated to be new record high of 708.7B yen (+33% QoQ) G 106 Investor Relations / July 30, 2026 18
▪ This slide shows FY2027 SPE new equipment sales forecast. ▪ The new equipment sales in the first half of this fiscal year are expected to grow by 45% year-over-year to 1 trillion 240 billion yen. ▪ The breakdown by application is shown on this slide. ▪ Driven by the AI server demand, sales of our systems for high-end devices are expected to increase. ▪ The new equipment sales in the second quarter are expected to hit quarterly record, topping 700 billion yen.
FY2027 R&D Expenses and Capex Plan B 45 (Billion yen) 400 R&D expenses Light Gray 335.0 R 244 277.8 G 244 300 250.0 B 244 202.8 191.1 G 255 100 Magenta FY2023 FY2024 FY2025 FY2026 FY2027 R 218 Estimate Miyagi Innovative Production Center Purple (Billion yen) Kurokawa-gun, Miyagi Prefecture/ Completion scheduled for summer 2027 R 128 300 Capex Depreciation B 167 216.0 190.0 Goal of the Smart Production Concept Turquoise 200 162.1 Labor Productivity Space Efficiency R0 121.8
1/3 3x B 32 Estimate B0 Continue strengthening competitiveness with a focus on R&D investment Orange Leveraging this solid infrastructure to steadily capture future gains G 106 Investor Relations / July 30, 2026 19
▪ This slide shows our plan for R&D expenses and capex. ▪ There are no changes here. ▪ In FY2027, we plan full-year R&D expenses of 330 billion yen. We will actively promote R&D to enhance the foundation of our technology competitive edge and support semiconductor technology innovation. ▪ For capex, we plan to spend 190 billion yen on the full year basis. ▪ Capex is mainly composed of acquisition of machines for the development buildings whose construction was completed in the previous fiscal year as well as construction of the new Miyagi Innovative Production Center to be completed next summer as a smart fab. ▪ We will utilize the robust infrastructure shown on this slide and capitalize on future business opportunities to maximize our corporate value.
(Yen) Dividend per Share G 244 400 White 364 B 255 300 327 TEL shareholder return policy R 218 265 264 Dividend payout ratio: 50% G 24 245 200 Annual DPS of not less than 50 yen Purple We will review our dividend policy if the company does not generate R 128 net income for two consecutive fiscal years B 167 148 Turquoise 100 We will flexibly consider share buybacks
R 120 H1 H2 H1 H2 H1 H2 H1 B 32 FY2024 FY2024 FY2025 FY2025 FY2026 FY2026 FY2027 (Estimate) Dividend per share for H1 FY2027 (interim dividend) is updated to 384 yen G 106 Investor Relations / July 30, 2026 20
▪ Next, I will present the dividend forecast. ▪ Following the upward revision of FY2027 first-half financial estimate, FY2027 interim dividend is expected to be 384 yen per share. This also is expected to be record high.
White ▪ Resolution of the Board of Directors’ meeting held on May 29, 2026 – Type of shares to be acquired: Shares of common stock Magenta – Total number of shares to be repurchased: Up to 7.5 million shares* (Equivalent to 1.6% of outstanding shares excluding treasury stock) Purple – Total purchase amount for share repurchase: Up to 150 billion yen* – Period of repurchase: From June 1, 2026 to March 31, 2027 * Depending on market environment and other factors, it is possible that a share repurchase of only a portion of the above, will be carried out. ▪ Status of Share Repurchase as of June 30, 2026 Green – Total number of shares repurchased: 207,100 shares – Total purchase amount for share repurchase: 11,474,246,000 yen TEL will continue to manage our balance sheet appropriately, considering our ability Orange to generate cash, necessary cash on hand and growth investment capital G 106 Investor Relations / July 30, 2026 21
▪ The share repurchase is proceeding as shown here, in line with the program of up to 150 billion yen decided in the Board of Directors meeting on May 29, 2026. ▪ We will conduct appropriate balance sheet management.
R 244 By implementing the stock split to lower the minimum investment, we B 244 ◼ Purpose intend to make shares more affordable for investors, with a view to expanding the investor base Each share of common stock owned by shareholders listed or recorded R 218 ◼ Split Method in the closing register of shareholders on the record date of Wednesday, B 132 September 30, 2026, will be split into 5 shares Date of public notice of record date: September 15, 2026 (Tuesday) ◼ Schedule Record date: September 30, 2026 (Wednesday) R0 Effective date: October 1, 2026 (Thursday)
As the effective date of the stock split is October 1, 2026, the interim R 120 dividends for the fiscal year ending March 2027, to all shareholders with ◼ Dividends a record date of September 30, 2026, will be implemented based on the R 238 number of shares issued prior to the stock split
▪ As for the stock split we announced together with the share repurchase, we will split each share of common stock into five shares with the record date of September 30, 2026. ▪ By lowering the minimum investment, we will make our shares more affordable for investors to expand the investor-base.
Shingo Tada *2 Tatsuya Aso*2 R 128 Customer Strategy, Global Customer Engineering Global Business Platform Kazuhiro Doh *2 Turquoise *1 Concurrently serves as TEL Corporate Director Corporate Strategy & Planning *2 New Representative
▪ Finally, I will present the new management structure commencing July 1, 2026. ▪ Toward sustainable growth and corporate value enhancement of Tokyo Electron, we have established the structure ensuring to promote our growth strategy ▪ The seven Corporate Officers shown here are going to swiftly work on business management as the top execution team. ▪ We have newly established COO to power up both of the two wheels, namely strategy development and its implementation. ▪ CEO is responsible for developing mid-term management plan and further-ahead mid- and long-term strategies and raising corporate value. COO is responsible for overseeing business operations and executions based on the strategies to ensure their implementation. ▪ In addition, we will clearly define a person in charge of execution for each function and business domain, such as CFO in charge of finance, to enhance velocity and effectiveness of management execution.
R 120 Sam Tatsuya Jack Peter Ray B 32 Nakama Nagakubo Ishida Loewenhardt Huang Yellow President Executive Advisor Senior Executive General Manager, Moderator R 238 Tokyo Electron Taiwan Tokyo Electron Vice President & COO Technology Strategy Account Sales Director Chairman Tokyo Electron Tokyo Electron Tokyo Electron Taiwan Tokyo Electron Taiwan G 106 Investor Relations / July 30, 2026 25