
Tokio Marine (8766) · Insurance
Tokio Marine Q1 FY2026 earnings: summary, key numbers & outlook
Results filed 12 Aug 2026 · Quarter ended 30 Jun 2026
Slides (28 pages)Press release ↗Investor relations ↗
Summaries and transcripts are machine-generated and can contain errors.
In brief
Tokio Marine's International business grew net premiums written 16.6% while holding underwriting discipline, but liability losses in North America left its Japan P&C unit behind plan.
International led the quarter, with net premiums written up 16.6% and North America driving growth. Medical Stop Loss rate increases lifted Employee Benefits, Latin America grew fastest, and Asia-Pacific beat plan on Singapore life and Malaysia. In Japan, motor premiums rose and Japan Life's new variable-accumulation whole life product sold well. Solution revenue fell on a fiscal year-end change at ID&E and weaker public-sector demand.
Management is steering toward more rate-driven growth in Japan, with motor rate increases expected to show more from Q2, while keeping International underwriting disciplined. The main tension is that softening North American specialty markets, intensifying price competition in Latin America and rising claims severity in Japan could squeeze margins. Large liability losses in North America left Japan P&C behind plan.
No call transcript for this quarter, so this summary also draws on: Reinsurance News ↗.
Slides & documents
Open the slide deck (PDF, 28 pages) ↗

Showing the first 6 of 28 pages.
Results documents
Key numbers
- Insurance revenue · GAAP
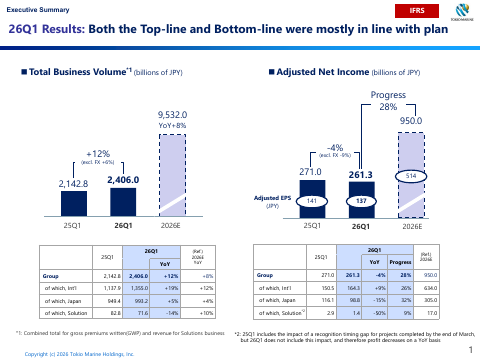
- 2,047.1 billion yen
- Net income attributable to owners of the parent · GAAP
- 264.3B
- Diluted EPS · GAAP
- 138.16 yen
- Adjusted EPS · non-GAAP
- 137
- Adjusted net income · non-GAAP
- 261.3 billion yen
up 12.3% from the same period of the previous year
up 3.3% from a year ago
up from 133.38 yen a year ago
down from 141 a year ago
down 3.6% from the same period of the previous year
| Segment or metric | Value | Change |
|---|---|---|
| International insurance revenue | 1,225.8 billion yen | up 194.5 billion yen from the same period of the previous year |
| Japan insurance revenue | 832.7 billion yen | up 23.3 billion yen from the same period of the previous year |
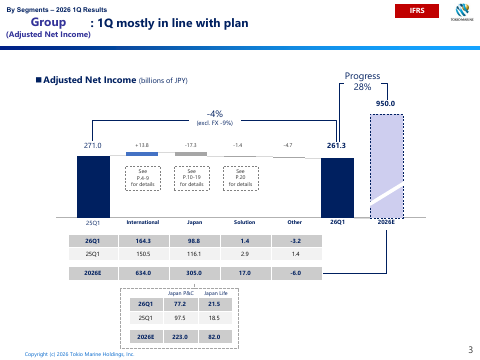
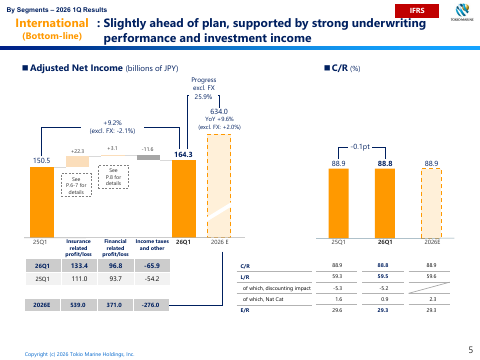
| International adjusted net income | 164.3 billion yen | up 13.8 billion yen from the same period of the previous year |
| Japan P&C adjusted net income | 77.2 billion yen | down 20.3 billion yen from the same period of the previous year |
| Japan Life CSM balance | 1,147.0 billion yen | down 2.6 billion yen from March 31, 2026 |
Where each number comes from
- Insurance revenue: “This consisted of Insurance revenue of 2,047.1 billion yen, Insurance service expenses of 1,569.4 billion yen, and Income or expenses from reinsurance contracts held of (125.9) billion yen.”
- Net income attributable to owners of the parent: “Net income attributable to: Owners of the parent 255,959 264,300 Non-controlling interests 10,723 22,586”
- Diluted EPS: “Earnings per share Earnings per share - Basic 133.49 yen 138.25 yen Earnings per share - Diluted 133.38 yen 138.16 yen”
- Adjusted EPS: “Three months ended June 30, 2026 138.25 138.16 261,351 (3.6) 137 Three months ended June 30, 2025 133.49 133.38 271,061 - 141”
- Adjusted net income: “Adjusted net income decreased by 9.7 billion yen to 261.3 billion yen from the same period of the previous year.”
- International insurance revenue: “In the International insurance business, Insurance revenue increased by 194.5 billion yen to 1,225.8 billion yen from the same period of the previous year.”
- Japan insurance revenue: “In the Japan insurance business, Insurance revenue increased by 23.3 billion yen to 832.7 billion yen from the same period of the previous year.”
- International adjusted net income: “Adjusted net income increased by 13.8 billion yen to 164.3 billion yen from the same period of the previous year.”
- Japan P&C adjusted net income: “Adjusted net income decreased by 20.3 billion yen to 77.2 billion yen from the same period of the previous year.”
- Japan Life CSM balance: “Contractual Service Margin balance decreased by 2.6 billion yen to 1,147.0 billion yen from March 31, 2026.”
Copied from the press release ↗ and other documents in the company's results page ↗. A figure is published only if its sentence is in those documents.
Outlook
| Metric | Period | Outlook |
|---|---|---|
| Net income attributable to owners of the parent (million yen) | fiscal year 2026 | 830,000 |
| Earnings per share (basic, yen) | fiscal year 2026 | 441.83 |
| Adjusted net income (million yen) | fiscal year 2026 | 950,000 |
| Adjusted EPS (yen) | fiscal year 2026 | 514 |
Key takeaways
International premiums grew 16.6%, led by North America
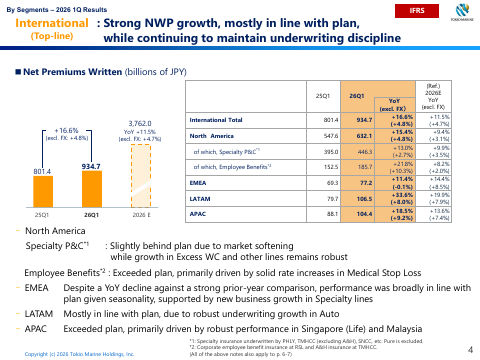
International net premiums written reached JPY 934.7bn, with North America at JPY 632.1bn. Growth was mostly in line with plan, so overseas expansion is the main growth engine.
Medical Stop Loss pricing drove Employee Benefits ahead of plan
Employee Benefits exceeded plan on solid rate increases in Medical Stop Loss, with Group Life also robust. Pricing power in this line is offsetting softer conditions elsewhere.
North American specialty faces market softening
Specialty P&C premiums were slightly behind plan because of market softening, though Excess workers' compensation and other lines kept growing robustly. Growth is increasingly dependent on selected lines.
Latin America grew fastest despite price competition
LATAM net premiums written rose 33.6%, driven by Auto underwriting, and profitability beat plan despite intensifying price competition. Management credits underwriting discipline for holding the loss ratio.
Japan P&C lagged on North American liability losses
Japan P&C profit was behind plan mainly because of large liability losses in North America, and motor claims severity rose with inflation. Motor rate increases are expected to become more pronounced from Q2.
Questions
What drove Tokio Marine's International growth this quarter?
International net premiums written rose 16.6% to JPY 934.7bn, led by North America. Employee Benefits benefited from Medical Stop Loss rate increases, while LATAM and APAC also grew.
Where did Tokio Marine fall short of its own plan?
Japan P&C was behind plan because of large liability losses in North America. Solution was also behind on ID&E's fiscal year-end change and weaker public-sector demand.
Is competition affecting Tokio Marine's pricing?
Yes. North American specialty is seeing market softening, and LATAM faces intensifying price competition. Management says underwriting discipline kept the LATAM loss ratio favorable.
How is Japan Life's new business performing?
Annualized premium of new policies rose 13.6% year on year, helped by regular premium variable insurance and a variable-accumulation whole life product launched in September 2025. New business CSM fell 22.0% on system investments supporting consultative sales.
What is happening with Japan motor insurance pricing?
Motor premiums rose, and management expects rate increases to become more pronounced from Q2. Claims severity is rising with inflation, with unit prices up 7.5% year on year against a projection of +6%.