
Teladoc Health (TDOC) · Health Care
Teladoc Health Q3 2026 earnings: summary, key numbers & outlook
Results filed 28 Oct 2026 · Quarter ended 30 Sep 2026
Slides (14 pages)Press release ↗Investor relations ↗
Summaries and transcripts are machine-generated and can contain errors.
In brief
Teladoc Health began rolling out Teladoc One with early launch partners while BetterHelp shifted toward insurance-covered therapy, reaching 3,000+ new therapists in the quarter.
Teladoc Health advanced its Integrated Care offering, implementing Teladoc One, a new comprehensive care model, with early launch partners, and expanding hybrid care and AI-enabled tools. Chronic care enrollment reached 1.344 million, up 15%, even as U.S. Integrated Care members slipped 2% to 100.1 million. At BetterHelp, insurance-covered revenue grew from a small base to $32.1 million as cash-pay users kept declining.
Management is steering BetterHelp from direct-to-consumer cash pay toward insurance coverage, which depends on adding provider capacity and building claims, scheduling and eligibility workflows. The tension is that cash-pay users are falling faster than insurance volume is ramping, and BetterHelp's fourth-quarter outlook implies a steeper decline. Teladoc One is also still early, with any benefit expected in 2027.
No call transcript for this quarter, so this summary also draws on: TradingKey ↗.
Slides & documents
Open the slide deck (PDF, 14 pages) ↗


Showing the first 6 of 14 pages.
From Teladoc Health investor relations
SEC filing
Key numbers
- Revenue
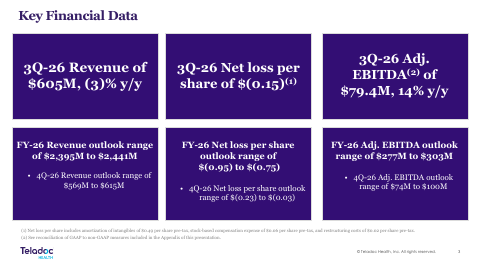
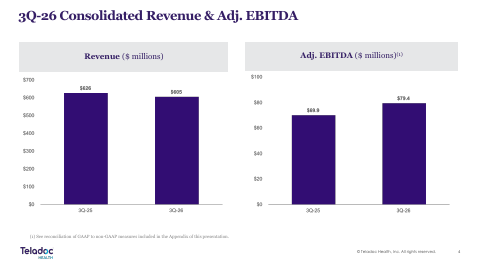
- $605.1 million
- Net loss · GAAP
- $26.9 million
- Net loss per share · GAAP
- $0.15
- Adjusted EBITDA · non-GAAP
- $79.4 million
- Operating cash flow · GAAP
- $106.5 million
- Free cash flow · non-GAAP
- $75.9 million
down 3% year-over-year
compared to $49.5 million in Third Quarter 2025
compared to $0.28 in Third Quarter 2025
up 14% year-over-year
compared to $99.3 million in Third Quarter 2025
compared to $67.9 million in Third Quarter 2025
| Segment or metric | Value | Change |
|---|---|---|
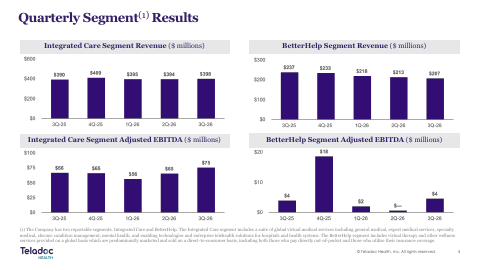
| Integrated Care revenue | $398.5 million | up 2% year-over-year |
| BetterHelp revenue | $206.6 million | down 13% year-over-year |
| BetterHelp Insurance Covered Services revenue | 32.1M | n/m (from 3,675 a year ago) |
| U.S. Integrated Care Members | 100.1M | (2)% |
| Chronic Care Program Enrollment | 1.3M | 15% |
| BetterHelp Paying Users (monthly average) | 336.0K | (12)% |
Where each number comes from
- Revenue: “Third Quarter 2026 revenue of $605.1 million, down 3% year-over-year”
- Net loss: “Third Quarter 2026 net loss of $26.9 million, or $0.15 per share”
- Net loss per share: “Third Quarter 2026 net loss of $26.9 million, or $0.15 per share”
- Adjusted EBITDA: “Third Quarter 2026 adjusted EBITDA of $79.4 million, up 14% year-over-year”
- Operating cash flow: “Cash flow from operations was $106.5 million in Third Quarter 2026, compared to $99.3 million in Third Quarter 2025”
- Free cash flow: “Free cash flow was $75.9 million in Third Quarter 2026, compared to $67.9 million in Third Quarter 2025”
- Integrated Care revenue: “Integrated Care segment revenue of $398.5 million, up 2% year-over-year, and adjusted EBITDA margin of 18.8%”
- BetterHelp revenue: “BetterHelp segment revenue of $206.6 million, down 13% year-over-year, and adjusted EBITDA margin of 2.2%”
- BetterHelp Insurance Covered Services revenue: “Consumer and Other | $174,533 | $233,226 | (25)% | $570,848 | $711,389 | (20)% Insurance Covered Services | 32,108 | 3,675 | n/m”
- U.S. Integrated Care Members: “U.S. Integrated Care Members (2) | 100.1 | 102.5 | (2)%”
- Chronic Care Program Enrollment: “Chronic Care Program Enrollment (4) | 1.344 | 1.165 | 15%”
- BetterHelp Paying Users (monthly average): “BetterHelp Paying Users (6) | 0.336 | 0.382 | (12)%”
Copied from the press release ↗ and other documents in the SEC filing ↗. A figure is published only if its sentence is in those documents.
| From the filing | Q3 2026 | vs year ago | vs last quarter |
|---|---|---|---|
| Revenue | $605.1M | −3.4% | −0.3% |
| Operating income | -$28.1M | +45.9% | +24.2% |
| Net income | -$26.9M | +45.6% | +30.8% |
| Diluted EPS | -$0.15 | +46.4% | +28.6% |
| Free cash flow | $105.2M | +8.5% | +65.1% |
| Operating margin | -4.6% | +3.7 pts | +1.5 pts |
Calculated by code from XBRL, not by the model.
Guidance check
| Metric | Outlook given with Q2 2026 | Reported | Result |
|---|---|---|---|
| Revenue | $569 - $609 million | $605.1M | within the range |
Compared with the company's own guidance, not analyst estimates, and only where the outlook and the reported figure are the same measure on the same basis. Ranges are worked out by code from the company's wording. How this works.
Outlook
| Metric | Period | Outlook |
|---|---|---|
| Revenue | full year 2026 | $2,395 - $2,441 million |
| Adjusted EBITDA | full year 2026 | $277 - $303 million |
| Net loss per share | full year 2026 | ($0.95) - ($0.75) |
| Free cash flow | full year 2026 | $135 - $165 million |
| Revenue | fourth quarter of 2026 | $569 - $615 million |
| Adjusted EBITDA | fourth quarter of 2026 | $74 - $100 million |
| Net loss per share | fourth quarter of 2026 | ($0.23) - ($0.03) |
Key takeaways
Teladoc One is being implemented with early partners
Management says it is implementing Teladoc One, billed as a first-of-its-kind comprehensive care model, with early launch partners. Some benefit is expected in 2027, so it is a future driver rather than a current one.
BetterHelp insurance sessions reached 27,000 per week
Weekly insurance-covered sessions have grown to a recent 27,000, and insurance-covered revenue was $32,108 thousand versus $3,675 thousand a year earlier. This is the core of BetterHelp's move away from cash pay.
Provider capacity is the constraint BetterHelp is attacking
Over 3,000 therapists were added to the network during the quarter. Capacity by state and payer, plus credentialing and enrollment, is listed as a key risk to scaling covered services.
Cash-pay BetterHelp users continue to decline
BetterHelp paying users averaged 0.336 million, down 12%, and Consumer and Other revenue fell 25%. Management attributes the segment decline to prioritizing Insurance Covered Services and fewer users paying out of pocket.
Chronic care enrollment grew while member access shrank
Chronic Care Program Enrollment rose 15% to 1.344 million, and average monthly revenue per U.S. Integrated Care member rose 5% to $1.33. U.S. Integrated Care Members fell 2% to 100.1 million, and the outlook is for 99.5 to 100.5 million.
Charts
Fourth quarter worked out from the annual figure.
Data
| Q4 2024 | $640.5M * |
| Q1 2025 | $629.4M |
| Q2 2025 | $631.9M |
| Q3 2025 | $626.4M |
| Q4 2025 | $642.3M * |
| Q1 2026 | $613.8M |
| Q2 2026 | $606.9M |
| Q3 2026 | $605.1M |
Data
| Q1 2025 | -$0.53 |
| Q2 2025 | -$0.19 |
| Q3 2025 | -$0.28 |
| Q1 2026 | -$0.36 |
| Q2 2026 | -$0.21 |
| Q3 2026 | -$0.15 |
Fourth-quarter EPS appears once the press release is read; filings report it only for the full year.
Data
| Q4 2024 | -7.5% |
| Q1 2025 | -19.2% |
| Q2 2025 | -8.6% |
| Q3 2025 | -8.3% |
| Q4 2025 | -5.6% |
| Q1 2026 | -10.1% |
| Q2 2026 | -6.1% |
| Q3 2026 | -4.6% |
Data
| Q4 2024 | $79.8M |
| Q1 2025 | $13.2M |
| Q2 2025 | $90.2M |
| Q3 2025 | $97.0M |
| Q4 2025 | $85.1M |
| Q1 2026 | $7.9M |
| Q2 2026 | $63.7M |
| Q3 2026 | $105.2M |
Operating cash flow minus capital expenditure, from cash flow statements.
Questions
What is Teladoc One?
Teladoc One is described as a first-of-its-kind, comprehensive care model that Teladoc Health is implementing with early launch partners. Management expects some benefit in 2027.
How is BetterHelp changing its business model?
BetterHelp is prioritizing Insurance Covered Services over direct out-of-pocket users. Insurance-covered revenue reached $32.1 million while Consumer and Other revenue fell 25%.
Is BetterHelp able to serve more insured patients?
Management cites progress expanding provider capacity, with over 3,000 therapists added during the quarter. Weekly insurance-covered sessions recently reached 27,000.
What AI and new care capabilities did Teladoc Health highlight?
The CEO cited hybrid care and AI-enabled solutions in Integrated Care. Coverage also points to AI-powered capabilities in the Solo platform that enable contact-free vital sign measurement.
What are the main risks to Teladoc Health's plan?
Listed risks include Teladoc One's performance, the pace of BetterHelp cash-pay declines, provider capacity by state and payer, and insurance claims and scheduling workflows. The fourth-quarter outlook also assumes BetterHelp revenue falls 18.5% to 31.5%.