
Teladoc Health (TDOC) · Health Care
Teladoc Health Q2 2026 earnings: summary, key numbers & outlook
Results filed 29 Jul 2026 · Quarter ended 30 Jun 2026
Slides (14 pages)Press release ↗Investor relations ↗
Summaries and transcripts are machine-generated and can contain errors.
In brief
Teladoc Health launched Teladoc One and sped up BetterHelp's nationwide insurance rollout as demand for insurance-covered therapy outpaced provider capacity while cash-pay users kept falling.
Teladoc Health launched Teladoc One, a connected care model for the U.S. market, and kept growing chronic care, with enrollment up 14% to 1.272 million. Integrated Care members fell 2% to 100.3 million, but revenue per member rose 3%. At BetterHelp, insurance-covered revenue reached $21.8 million as demand for insurance outran provider capacity, while cash-pay users kept leaving, especially from late May into June.
Management is steering BetterHelp toward insurance and pulled the nationwide insurance rollout ahead of plan. It is adding provider capacity and de-emphasizing international markets. The tension is that insurance demand is outrunning therapist supply, so sessions cannot convert fast enough to offset cash-pay losses. Insurance also carries a lower gross margin percentage than cash pay, and BetterHelp goodwill is flagged as a possible impairment risk.
No call transcript for this quarter, so this summary also draws on: Webull (Motley Fool transcript) ↗.
Slides & documents
Open the slide deck (PDF, 14 pages) ↗

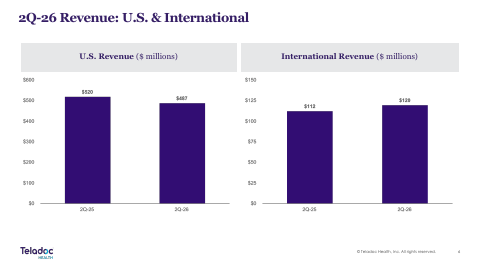
Showing the first 6 of 14 pages.
From Teladoc Health investor relations
SEC filing
Key numbers
- Revenue · GAAP
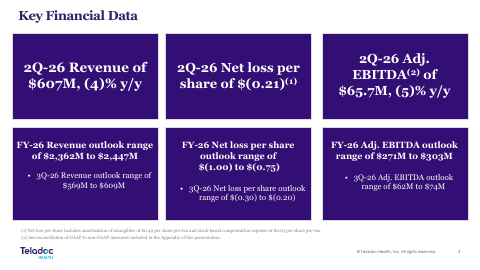
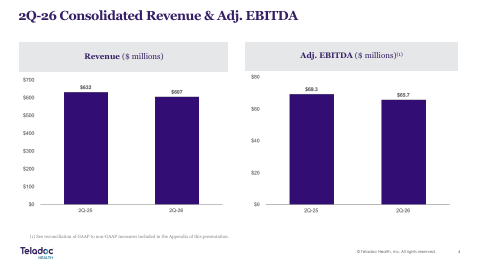
- $606.9 million
- Net loss · GAAP
- $38.9 million
- Net loss per share · GAAP
- $0.21
- Loss from operations · GAAP
- -37.1M
- Cash flow from operations · GAAP
- $64.7 million
- Free cash flow · non-GAAP
- $35.7 million
- Adjusted EBITDA · non-GAAP
- $65.7 million
down 4% year-over-year
compared with $32.7 million in Second Quarter 2025
compared with $0.19 in Second Quarter 2025
compared with (54,385) a year ago
compared with $91.4 million in Second Quarter 2025
compared with $61.2 million in Second Quarter 2025
down 5% year-over-year
| Segment or metric | Value | Change |
|---|---|---|
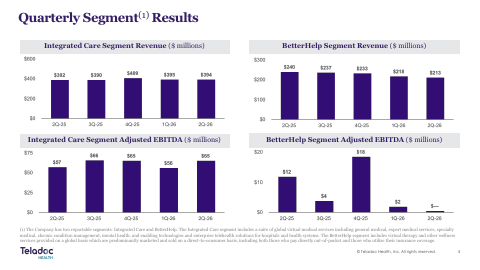
| Integrated Care revenue | $394.3 million | up 1% year-over-year |
| BetterHelp revenue | $212.6 million | down 12% year-over-year |
| BetterHelp insurance covered services revenue | 21.8M | compared with 2,128 a year ago |
| U.S. Integrated Care Members | 100.3 | down 2% |
| Chronic Care Program Enrollment | 1.272 | up 14% |
| BetterHelp Paying Users (millions, quarterly average) | 0.346 | down 11% |
| Average Monthly Revenue Per U.S. Integrated Care Member | $1.31 | up 3% |
| Total Visits | 4.1 | down 2% for the quarter by the stated change column |
Where each number comes from
- Revenue: “•Second Quarter 2026 revenue of $606.9 million, down 4% year-over-year”
- Net loss: “•Second Quarter 2026 net loss of $38.9 million, or $0.21 per share”
- Net loss per share: “•Second Quarter 2026 net loss of $38.9 million, or $0.21 per share”
- Loss from operations: “Loss from operations | (37,092) | (54,385) | (98,860) | (174,996)”
- Cash flow from operations: “Cash flow from operations was $64.7 million in Second Quarter 2026, compared to $91.4 million in Second Quarter 2025”
- Free cash flow: “Free cash flow was $35.7 million in Second Quarter 2026, compared to $61.2 million in Second Quarter 2025”
- Adjusted EBITDA: “•Second Quarter 2026 adjusted EBITDA of $65.7 million, down 5% year-over-year”
- Integrated Care revenue: “•Integrated Care segment revenue of $394.3 million, up 1% year-over-year, and adjusted EBITDA margin of 16.5%”
- BetterHelp revenue: “•BetterHelp segment revenue of $212.6 million, down 12% year-over-year, and adjusted EBITDA margin of 0.2%”
- BetterHelp insurance covered services revenue: “Insurance Covered Services | 21,770 | 2,128 | N/M | 34,707 | 2,128 | N/M”
- U.S. Integrated Care Members: “U.S. Integrated Care Members (2) | 100.3 | 102.4 | (2)%”
- Chronic Care Program Enrollment: “Chronic Care Program Enrollment (4) | 1.272 | 1.117 | 14%”
- BetterHelp Paying Users (millions, quarterly average): “BetterHelp Paying Users (6) | 0.346 | 0.388 | (11)% | 0.353 | 0.393 | (10)%”
- Average Monthly Revenue Per U.S. Integrated Care Member: “Average Monthly Revenue Per U.S. Integrated Care Member (5) | $1.31 | $1.27 | 3% | $1.31 | $1.27 | 3%”
- Total Visits: “Total Visits | 4.1 | 4.1 | (2)% | 8.4 | 8.6 | (2)%”
Copied from the press release ↗ and other documents in the SEC filing ↗. A figure is published only if its sentence is in those documents.
| From the filing | Q2 2026 | vs year ago | vs last quarter |
|---|---|---|---|
| Revenue | $606.9M | −4.0% | −1.1% |
| Operating income | -$37.1M | +31.8% | +39.9% |
| Net income | -$38.9M | −19.1% | +39.1% |
| Diluted EPS | -$0.21 | −10.5% | +41.7% |
| Free cash flow | $63.7M | −29.3% | +711.3% |
| Operating margin | -6.1% | +2.5 pts | +4.0 pts |
Calculated by code from XBRL, not by the model.
Outlook
| Metric | Period | Outlook |
|---|---|---|
| Revenue | third quarter of 2026 | $569 - $609 million |
| Adjusted EBITDA | third quarter of 2026 | $62 - $74 million |
| Net loss per share | third quarter of 2026 | ($0.30) - ($0.20) |
| Revenue | full year 2026 | $2,362 - $2,447 million |
| Adjusted EBITDA | full year 2026 | $271 - $303 million |
| Net loss per share | full year 2026 | ($1.00) - ($0.75) |
| Free cash flow | full year 2026 | $130 - $170 million |
| BetterHelp revenue growth (year-over-year) | full year 2026 BetterHelp revenue growth | (19.0%) - (12.7%) |
| Integrated Care revenue growth (year-over-year) | full year 2026 Integrated Care revenue growth | 0.8% - 2.4% |
Key takeaways
Teladoc One launched as a connected care model
Teladoc Health introduced Teladoc One, a new connected care model for the U.S. market, as its latest innovation for clients and members. It is meant to deepen the value Integrated Care delivers to health plans and employers.
BetterHelp accelerated its nationwide insurance rollout
Insurance-covered services grew to $21,770 thousand in revenue from $2,128 thousand a year earlier. Management moved the rollout ahead of plan because consumers strongly prefer insurance, and it is taking further steps to scale it.
Provider capacity is the bottleneck in insurance therapy
Demand for insurance-covered services outpaced available providers, limiting conversion into sessions. Capacity is growing but not as fast as demand, so recruitment and credentialing now determine how fast the segment can grow.
Cash-pay erosion worsened in late May and June
Pressure on cash-pay revenue accelerated beyond prior assumptions, and BetterHelp paying users fell 11% to 0.346 million. Management lowered the BetterHelp revenue outlook while keeping its 2026 insurance revenue range.
Chronic care enrollment grew 14% on bundled programs
Chronic Care Program Enrollment reached 1.272 million, up from 1.117 million. Integrated Care revenue growth and margin came in above the midpoint of guidance, supported by client adoption of multi-condition bundles.
Charts
Fourth quarter worked out from the annual figure.
Data
| Q4 2024 | $640.5M * |
| Q1 2025 | $629.4M |
| Q2 2025 | $631.9M |
| Q3 2025 | $626.4M |
| Q4 2025 | $642.3M * |
| Q1 2026 | $613.8M |
| Q2 2026 | $606.9M |
| Q3 2026 | $605.1M |
Data
| Q1 2025 | -$0.53 |
| Q2 2025 | -$0.19 |
| Q3 2025 | -$0.28 |
| Q1 2026 | -$0.36 |
| Q2 2026 | -$0.21 |
| Q3 2026 | -$0.15 |
Fourth-quarter EPS appears once the press release is read; filings report it only for the full year.
Data
| Q4 2024 | -7.5% |
| Q1 2025 | -19.2% |
| Q2 2025 | -8.6% |
| Q3 2025 | -8.3% |
| Q4 2025 | -5.6% |
| Q1 2026 | -10.1% |
| Q2 2026 | -6.1% |
| Q3 2026 | -4.6% |
Data
| Q4 2024 | $79.8M |
| Q1 2025 | $13.2M |
| Q2 2025 | $90.2M |
| Q3 2025 | $97.0M |
| Q4 2025 | $85.1M |
| Q1 2026 | $7.9M |
| Q2 2026 | $63.7M |
| Q3 2026 | $105.2M |
Operating cash flow minus capital expenditure, from cash flow statements.
Questions
What is Teladoc One?
Teladoc One is a new connected care model for the U.S. market that Teladoc Health launched this quarter. Management presented it as part of efforts to strengthen the value it provides to clients and members.
Why did BetterHelp's outlook get lowered?
Cash-pay pressure accelerated in late May and June beyond prior assumptions, and insurance demand outpaced provider capacity, so it could not offset the decline. Management lowered the BetterHelp revenue outlook but kept its 2026 insurance revenue range.
How is BetterHelp's insurance push going?
Insurance-covered revenue was $21.8 million, up from $2.1 million a year earlier, and the nationwide rollout was accelerated ahead of plan. Constraints are provider capacity and a lower gross margin percentage than cash pay.
How are Integrated Care customers and members trending?
U.S. Integrated Care Members fell 2% to 100.3 million, while average monthly revenue per member rose 3% to $1.31. Chronic care enrollment grew 14% to 1.272 million.
Where is management taking BetterHelp next?
Management is prioritizing the growing insurance market and scaling provider capacity, and it is reducing near-term emphasis and investment outside the United States. Cash-pay decline and provider recruitment remain the key risks.