
Roblox (RBLX) · Media & Streaming
Roblox Q3 2026 earnings: summary, key numbers & outlook
Results filed 29 Oct 2026 · Quarter ended 30 Sep 2026
Slides (41 pages)Official transcript (PDF) ↗Press release ↗Investor relations ↗
Summaries and transcripts are machine-generated and can contain errors.
In brief
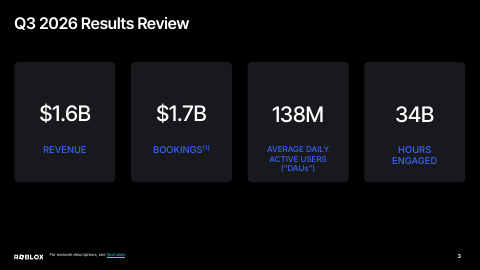
Roblox Q3 2026 revenue was $1.6 billion, up 16% year-over-year, while bookings of $1.7 billion were down 12% year-over-year and consolidated net loss was $230 million.
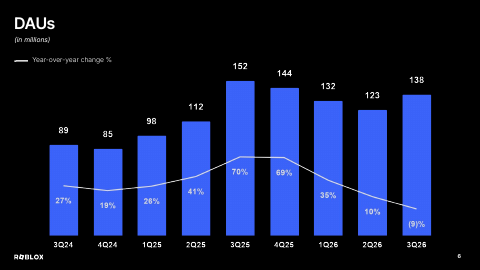
Roblox's Q3 2026 revenue rose 16% to $1.6 billion, but bookings, the cash-based measure of what players spent, fell 12% to $1.7 billion. The company says it is lapping an extraordinary 2025. Daily active users were 138 million, down 9% from a year ago but up 12% from Q2. Net loss narrowed to $230 million, and operating cash flow was $395 million.
For Q4, management expects revenue to grow 4% to 12% year-over-year while bookings decline 10% to 15%. Revenue is still growing because it recognizes most bookings over 27 months, so strong 2025 bookings keep flowing through. The main tension is weaker spending and fixed-cost deleveraging against heavy AI and growth investment, with free cash flow guided to negative $190 million to negative $105 million.
Slides & documents
Open the slide deck (PDF, 41 pages) ↗

Showing the first 6 of 41 pages.
From Roblox investor relations
- Shareholder LetterShareholder letter ↗
- TranscriptCompany's official transcript ↗
- Earnings WebcastWebcast replay ↗
- Investor Data SheetDocument ↗
SEC filing
Key numbers
- Revenue · GAAP
- $1.6 billion
- Bookings · non-GAAP
- $1.7 billion
- Consolidated net loss · GAAP
- $230 million
- Net loss per share, basic and diluted · GAAP
- $ (0.32)
- Loss from operations · GAAP
- -$283.0M
- Operating cash flow · GAAP
- $395 million
- Free cash flow · non-GAAP
- $364 million
- Adjusted EBITDA · non-GAAP
- $138 million
up 16% year-over-year
down 12% year-over-year
compared to $258 million in Q3 2025
compared to $ (0.37) in Q3 2025
compared to (296) in Q3 2025
compared to $546 million in the prior-year period
compared to $443 million in Q3 2025
compared to $46 million in Q3 2025
| Segment or metric | Value | Change |
|---|---|---|
| Daily active users (DAUs) | 138 million | down 9% year-over-year |
| Hours engaged | nearly 34 billion | down 15% year-over-year |
| Average monthly unique payers | 30 million | down 16% year-over-year |
| Bookings per Hour | approximately 4% | year-over-year growth globally |
| O18 share of global age-checked DAUs | 29% | up from 27% as of Q2'26 |
Where each number comes from
- Revenue: “Revenue for the quarter was $1.6 billion, up 16% year-over-year, and bookings were $1.7 billion, surpassing the high end of our guidance range”
- Bookings: “Revenue for the quarter was $1.6 billion, up 16% year-over-year, and bookings were $1.7 billion, surpassing the high end of our guidance range”
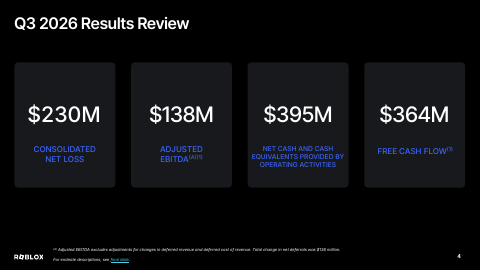
- Consolidated net loss: “Consolidated net loss was $230 million, compared to $258 million in Q3 2025.”
- Net loss per share, basic and diluted: “Net loss per share attributable to common stockholders, basic and diluted $ (0.32) $ (0.37) $ (0.92) $ (1.09)”
- Loss from operations: “Loss from operations (283) (296) (806) (873) Interest income 60 52 174 147”
- Operating cash flow: “In Q3, operating cash flow was $395 million and free cash flow was $364 million.”
- Free cash flow: “In Q3, operating cash flow was $395 million and free cash flow was $364 million.”
- Adjusted EBITDA: “Adjusted EBITDA was $138 million, compared to $46 million in Q3 2025.”
- Daily active users (DAUs): “In Q3, DAUs were 138 million, down 9% year-over-year, and Hours reached nearly 34 billion, down 15% year-over-year”
- Hours engaged: “In Q3, DAUs were 138 million, down 9% year-over-year, and Hours reached nearly 34 billion, down 15% year-over-year”
- Average monthly unique payers: “Average monthly unique payers (MUPs) totaled 30 million, down 16% year-over-year”
- Bookings per Hour: “Bookings per Hour grew approximately 4% year-over-year globally and 2% year-over-year in the U.S. and Canada”
- O18 share of global age-checked DAUs: “O18 users represented 29% of global age-checked DAUs and 37% of U.S. age-checked DAUs”
Copied from the press release ↗ and other documents in the SEC filing ↗. A figure is published only if its sentence is in the filing.
| From the filing | Q3 2026 | vs year ago | vs last quarter |
|---|---|---|---|
| Revenue | $1.6B | +15.6% | +7.0% |
| Operating income | -$283.0M | +4.4% | −23.6% |
| Net income | -$227.0M | +11.3% | −24.0% |
| Diluted EPS | -$0.32 | +13.5% | −23.1% |
| Free cash flow | $367.0M | −17.2% | +24.0% |
| Operating margin | -18.0% | +3.8 pts | −2.4 pts |
Calculated by code from XBRL, not by the model.
Outlook
| Metric | Period | Outlook |
|---|---|---|
| Revenue growth year-over-year | Q4'26 | 4% to 12% |
| Bookings change year-over-year | Q4'26 | 10% to 15% |
| Operating cash flow | Q4'26 | $190 million to $275 million |
| Free cash flow | Q4'26 | $(190) million to $(105) million |
| Capital expenditures and purchases of intangible assets | Q4'26 | $ (380) |
Key takeaways
Revenue grew 16% while bookings fell 12%
Revenue was $1.6 billion, up 16% year-over-year, while bookings were $1.7 billion, down 12% year-over-year. Roblox recognizes most bookings as revenue over 27 months, so revenue lags bookings.
Audience shrank year-over-year but grew sequentially
DAUs were 138 million, down 9% year-over-year, but grew 12% quarter-over-quarter. Hours were nearly 34 billion, down 15% year-over-year.
Spending per hour improved while payers declined
Bookings per Hour grew approximately 4% year-over-year globally, and average bookings per MUP rose 5%. Average monthly unique payers were 30 million, down 16% year-over-year.
Q4 guidance points to falling bookings
Roblox expects Q4 bookings to decline 10% to 15% year-over-year and revenue to grow 4% to 12%. Management also expects fixed cost deleveraging versus the year-ago period.
Cash generation dips ahead of heavy Q4 capex
Q3 free cash flow was $364 million, versus $443 million a year earlier, helped by capital expenditures shifting into Q4. Q4 free cash flow is guided to $(190) million to $(105) million.
Charts
Fourth quarter worked out from the annual figure.
Data
| Q4 2024 | $988.2M * |
| Q1 2025 | $1.0B |
| Q2 2025 | $1.1B |
| Q3 2025 | $1.4B |
| Q4 2025 | $1.4B * |
| Q1 2026 | $1.4B |
| Q2 2026 | $1.5B |
| Q3 2026 | $1.6B |
Data
| Q1 2025 | -$0.32 |
| Q2 2025 | -$0.41 |
| Q3 2025 | -$0.37 |
| Q1 2026 | -$0.35 |
| Q2 2026 | -$0.26 |
| Q3 2026 | -$0.32 |
Fourth-quarter EPS appears once the press release is read; filings report it only for the full year.
Data
| Q4 2024 | -24.7% |
| Q1 2025 | -24.6% |
| Q2 2025 | -29.8% |
| Q3 2025 | -21.8% |
| Q4 2025 | -25.4% |
| Q1 2026 | -20.4% |
| Q2 2026 | -15.6% |
| Q3 2026 | -18.0% |
Data
| Q4 2024 | $120.6M |
| Q1 2025 | $427.0M |
| Q2 2025 | $176.0M |
| Q3 2025 | $443.0M |
| Q4 2025 | $309.4M |
| Q1 2026 | $596.0M |
| Q2 2026 | $296.0M |
| Q3 2026 | $367.0M |
Operating cash flow minus capital expenditure, from cash flow statements.
Questions
What were Roblox's main results for Q3 2026?
Revenue was $1.6 billion, up 16% year-over-year, and bookings were $1.7 billion, down 12%. Consolidated net loss was $230 million, versus $258 million a year earlier.
What is Roblox's guidance for Q4 2026?
Roblox expects revenue growth of 4% to 12% year-over-year and bookings to decline 10% to 15%. It guides operating cash flow of $190 million to $275 million and free cash flow of $(190) million to $(105) million.
Why is revenue growing while bookings are falling?
Roblox recognizes the vast majority of bookings as revenue over 27 months, so Q4'26 revenue includes flow-through from prior period bookings, particularly elevated bookings throughout 2025.
How did Roblox's user base and engagement trend in Q3 2026?
DAUs were 138 million, down 9% year-over-year but up 12% quarter-over-quarter. Hours engaged reached nearly 34 billion, down 15% year-over-year.
What did Roblox report for cash flow and capital returns?
Operating cash flow was $395 million and free cash flow was $364 million, with $6.2 billion in cash, cash equivalents and investments. Roblox repurchased 4.4 million shares for approximately $200 million.