OpenNashEarnings

MetLife (MET) · Insurance

MetLife Q3 2026 earnings call: transcript, summary & key numbers

Results filed 4 Nov 2026 · Quarter ended 30 Sep 2026 · Call 61 min · Michel Khalaf (CEO), John McCallion (CFO)

Read the transcriptSlides (25 pages)Press release ↗Investor relations ↗

Summaries and transcripts are machine-generated and can contain errors.

In brief

MetLife extended its embedded-insurance playbook with a multi-market Revolut partnership while top-line growth spread across all segments, even as U.S. pension risk transfer volume ran lighter.

MetLife grew in every business segment this quarter. Group Benefits benefited from strong sales and favorable working-age mortality, and Latin America and EMEA led on top-line growth. EMEA added a multi-market embedded-insurance partnership with Revolut. RIS growth came from post-retirement benefits and U.K. longevity reinsurance rather than U.S. pension risk transfer. MetLife Investment Management is folding in PineBridge, and institutional client assets under management rose 45% to $308 billion.

Management says it will keep funding organic growth first, then selective acquisitions, then buybacks. It named asset management and group benefits as areas of interest for deals, and it plans to keep using Chariot third-party capital to grow retirement. The tensions are how long favorable group life mortality lasts as competition normalizes it, disability claims trending up, and whether U.S. pension risk transfer volume really is just timing.

Slides & documents

Open the slide deck (PDF, 25 pages) ↗

MetLife Q3 2026 slide deck, page 1MetLife Q3 2026 slide deck, page 2MetLife Q3 2026 slide deck, page 3MetLife Q3 2026 slide deck, page 4MetLife Q3 2026 slide deck, page 5MetLife Q3 2026 slide deck, page 6

Showing the first 6 of 25 pages.

From MetLife investor relations

SEC filing

Key numbers

Total revenues · GAAP
$20.5B

Premiums, fees and other revenues · GAAP
$14.1 billion

up 12% from a year ago

Net income · GAAP
$2.4 billion

up 187% from a year ago

Net income per diluted share · GAAP
$3.67

up 201% from a year ago

Adjusted earnings per share · non-GAAP
$2.78

up 17% from a year ago

Adjusted EPS excluding notable items · non-GAAP
$2.85

up 22% from a year ago

Adjusted ROE excluding notable items · non-GAAP
19.6%

Segment or metricValueChange
Group Benefits adjusted earnings$523 millionup 15%
RIS adjusted earnings$413 milliondown 6%
RIS adjusted PFOs excluding PRT$1.6 billionup 33%
Asia adjusted earnings$602 millionup 11% reported, up 14% constant currency
Latin America adjusted earnings$215 millionup 45% reported, up 30% constant currency
EMEA adjusted earnings$108 millionup 24% reported, up 32% constant currency
MetLife Investment Management total AUM$723.4 billionup 14%
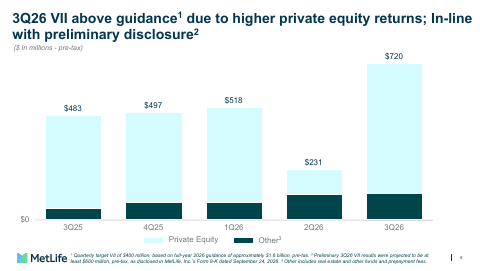
Variable investment income (pre-tax)$720 millionup 49%
Where each number comes from
  • Total revenues: “Net investment gains (losses) | (430) | (325) Net derivative gains (losses) | 698 | (929) Total revenues | $20,522 | $17,361”
  • Premiums, fees and other revenues: “Premiums, fees and other revenues (PFOs) increased 12% to $14.1 billion.”
  • Net income: “Net income increased 187%1 to $2.4 billion, or $3.67 per share.”
  • Net income per diluted share: “On a per-share basis, net income increased 201 percent to $3.67.”
  • Adjusted earnings per share: “On a per-share basis, adjusted earnings were $2.78, up 17 percent.”
  • Adjusted EPS excluding notable items: “Adjusted earnings per share up 22% to $2.85, excluding total notable items — highest-ever quarter for MetLife.”
  • Adjusted ROE excluding notable items: “Adjusted return on equity of 19.6%, excluding total notable items.”
  • Group Benefits adjusted earnings: “Adjusted earnings were $523 million, up 15 percent. Excluding notable items, adjusted earnings were $523 million, up 14 percent, primarily driven by favorable underwriting.”
  • RIS adjusted earnings: “Adjusted earnings were $413 million, down 6 percent, reflecting the impact of notable items from the annual actuarial assumption review.”
  • RIS adjusted PFOs excluding PRT: “Adjusted PFOs, excluding PRT, were $1.6 billion, up 33 percent, mainly driven by higher sales of post-retirement benefits and U.K. longevity reinsurance.”
  • Asia adjusted earnings: “Adjusted earnings were $602 million, up 11 percent on a reported basis and up 14 percent on a constant currency basis, reflecting the impact”
  • Latin America adjusted earnings: “Adjusted earnings were $215 million, up 45 percent on a reported basis and up 30 percent on a constant currency basis, reflecting the impact”
  • EMEA adjusted earnings: “Adjusted earnings were $108 million, up 24 percent on a reported basis and up 32 percent on a constant currency basis.”
  • MetLife Investment Management total AUM: “Total assets under management were $723.4 billion, up 14 percent.”
  • Variable investment income (pre-tax): “Adjusted net investment income was $6.0 billion, up 10 percent. VII increased 49 percent to $720 million.”

Copied from the press release ↗ and other documents in the SEC filing ↗. A figure is published only if its sentence is in those documents.

From the filingQ3 2026vs year agovs last quarter
Revenue$20.5B+18.2%+7.1%
Operating income$1.8B+10.7%+13.8%
Net income$2.4B+167.5%+225.7%
Diluted EPS$3.67+200.8%+236.7%
Operating margin8.9%−0.6 pts+0.5 pts

Calculated by code from XBRL, not by the model.

Outlook

MetricPeriodOutlook
MIM adjusted earnings targetfull year 2026$240 to $280 million
Effective tax rate on adjusted earnings202624 to 26%
Direct expense ratio targetfull year 202612.1 %
Adjusted ROE target rangefull year 202615 to 17 %
Variable investment income guidance (pre-tax)full year 2026$1.6 billion
Quarterly variable investment income run ratefourth quarter of 2026$400 million
Free cash flow ratiotwo-year target65 to 75 %

Key takeaways

  1. Revolut deal extends embedded insurance across Europe

    MetLife signed a multi-market partnership with Revolut, one of Europe's largest digital banks, to offer integrated insurance. Management says it is applying digital lessons from Latin America and EMEA, and soon Asia, under a OneMetLife approach.

  2. Group Benefits grows on sales and favorable mortality

    Group sales were up 12% year-to-date, with strength in National Accounts and Regional Business, while the group life mortality ratio was 79.5%. Management expects the mortality favorability to normalize only gradually because national accounts renew on three-to-five-year cycles.

  3. RIS growth shifts from U.S. PRT to U.K. products

    RIS adjusted PFOs excluding PRT rose 33%, driven by post-retirement benefits and U.K. longevity reinsurance, while U.S. pension risk transfer was lighter. Management calls the U.S. slowdown timing and says it expects more deals in the quarter.

  4. Chariot and PineBridge feed the asset-management engine

    Another Chariot deal closed at quarter end, and management sees third-party capital as a way to grow retirement and earn additional MIM fees. Institutional client AUM rose 45% to $308 billion, and the PineBridge integration is producing expense synergies and a more profitable mix.

  5. AI productivity offsets PineBridge's higher expense load

    Management calls AI a force multiplier that helps growth, customer experience and expenses, holding the direct expense ratio at 11.9% despite roughly 50 basis points from PineBridge. It is sticking with its 2029 expense ratio ambition for now.

Charts

Revenue$20.5B+18.2% y/yQ3 2026
Q4 2024: $18.7B (worked out from the annual figure)Q4 ’24$18.7BQ1 2025: $18.6BQ1 ’25$18.6BQ2 2025: $17.3BQ2 ’25$17.3BQ3 2025: $17.4BQ3 ’25$17.4BQ4 2025: $23.8B (worked out from the annual figure)Q4 ’25$23.8BQ1 2026: $19.1BQ1 ’26$19.1BQ2 2026: $19.2BQ2 ’26$19.2BQ3 2026: $20.5BQ3 ’26$20.5B

Fourth quarter worked out from the annual figure.

Data
Q4 2024$18.7B *
Q1 2025$18.6B
Q2 2025$17.3B
Q3 2025$17.4B
Q4 2025$23.8B *
Q1 2026$19.1B
Q2 2026$19.2B
Q3 2026$20.5B
Diluted EPS (GAAP)$3.67+200.8% y/yQ3 2026
Q1 2025: $1.28Q1 ’25$1.28Q2 2025: $1.03Q2 ’25$1.03Q3 2025: $1.22Q3 ’25$1.22Q1 2026: $1.74Q1 ’26$1.74Q2 2026: $1.09Q2 ’26$1.09Q3 2026: $3.67Q3 ’26$3.67
Data
Q1 2025$1.28
Q2 2025$1.03
Q3 2025$1.22
Q1 2026$1.74
Q2 2026$1.09
Q3 2026$3.67

Fourth-quarter EPS appears once the press release is read; filings report it only for the full year.

Operating margin8.9%−0.6 pts y/yQ3 2026
Q4 2024: 8.0%Q4 ’248.0%Q1 2025: 7.6%Q1 ’257.6%Q2 2025: 8.0%Q2 ’258.0%Q3 2025: 9.5%Q3 ’259.5%Q4 2025: 7.1%Q4 ’257.1%Q1 2026: 8.6%Q1 ’268.6%Q2 2026: 8.4%Q2 ’268.4%Q3 2026: 8.9%Q3 ’268.9%
Data
Q4 20248.0%
Q1 20257.6%
Q2 20258.0%
Q3 20259.5%
Q4 20257.1%
Q1 20268.6%
Q2 20268.4%
Q3 20268.9%

What management said

Each quote matches the transcript word for word.

“Embedded insurance is working here too. Our new multi-market partnership with Revolut, one of Europe's largest digital banks, offers a seamless integrated customer experience.”

Shows MetLife taking its embedded-insurance model from Latin America to European digital distribution.

0:08:50 · Michel Khalaf (CEO)

“AI is a force multiplier for us. It's helping us grow, improve customer experience, and operate with greater speed and precision, all while holding down our ratio as we absorb the acquisition of Pinebridge investment, a structurally higher expense business.”

Ties AI directly to growth, service and expense control during an acquisition integration.

0:04:48 · Michel Khalaf (CEO)

“While U .S. pension risk transfers activity has been lighter this year, we see this as timing, not a structural change.”

Management's stance on the main soft spot in retirement volume this year.

0:06:45 · Michel Khalaf (CEO)

“We can do that by leveraging third-party capital. That third-party capital can result in additional MIM fees for us. So we are still looking at Chariot as a strategic growth opportunity for us.”

Explains how Chariot links retirement growth, outside capital and asset-management fees.

0:41:13 · John McCallion (CFO)

“we don't need anything transformational, we'd be looking at, you know, the types of assets that can bring an adjacency, a capability, a solution or solutions that can help accelerate our growth trajectory.”

Defines the type of acquisition MetLife would pursue.

0:59:53 · Michel Khalaf (CEO)

“should these trends continue, we would expect the favorability to gradually normalize over time, but gradually being the operative word here.”

Sets expectations for how competition will erode favorable group life mortality.

0:34:15 · Rami (Executive)

Analyst Q&A

  1. 0:29:50 · Ryan Kruger, KBW · Non-medical health

    What drove the non-medical health loss ratio, split between disability and dental, given industry disability weakness?

    Disability showed slightly higher severity offset by strong claim recoveries, incidence was in line with plan, and dental benefited from pricing and network actions. — Rami

  2. 0:32:16 · Ryan Kruger, KBW · Expenses

    How much did stock compensation tied to the share price move raise expenses?

    It added roughly a point or two to the expense ratio. — John McCallion

  3. 0:33:35 · Sunit Kama, Jefferies · Group life mortality

    Is favorable working-age group life mortality running its course, and when does it reach pricing?

    It is hard to predict, but competition should normalize it gradually over years rather than quarters, with a seasonal uptick expected in the fourth and first quarters. — Rami

  4. 0:35:29 · Sunit Kama, Jefferies · Value of new business

    What drove the roughly 500 basis point rise in new-business IRR over ten years and is it sustainable?

    Management credits tools that put value-driven decision-making in leaders' hands, plus interest rates, mix shift toward higher-ROE businesses and legacy retail runoff, and believes it is sustainable. — John McCallion

  5. 0:37:57 · Tom Gallagher, Evercore ISI · Disability pricing

    How will disability pricing play out given competitors' elevated claims?

    Management sees a competitive but rationally priced market where pricing reflects experience, and it has planned for further claim uptick and is pricing for it at the account level. — Rami

  6. 0:40:30 · Tom Gallagher, Evercore ISI · Capital management

    Where does capital management stand on risk transfer with MetLife Holdings and reinsurance with Chariot Re?

    Nothing has changed: another Chariot deal closed at quarter end, it remains a strategic growth opportunity via third-party capital, and there is no burning platform for other risk transfer. — John McCallion, Rami

  7. 0:42:07 · Wes Carmichael, Wells Fargo · RIS spread

    How is the RIS base spread trending as long-term rates stay volatile?

    Core spread should stay within 95 to 100 basis points, and with variable investment income back at a normal run rate the total spread should return to 100 to 120 in the fourth quarter. — John McCallion

  8. 0:43:34 · Wes Carmichael, Wells Fargo · Free cash flow

    Is the direction of free cash flow conversion changing as growth opportunities expand?

    Management still expects to hold the 65 to 75% free cash flow ratio while supporting stronger growth, because capital generation is also stronger. — John McCallion

  9. 0:44:50 · Alex Scott, Barclays · Expense ratio

    How will the expense ratio progress into 2027?

    Management expects to beat this year's target despite absorbing PineBridge, credits AI and technology investment, and is keeping its 2029 ratio for now. — Michel Khalaf

  10. 0:46:38 · Alex Scott, Barclays · Japan cash flow

    Can MetLife use more reinsurance to release cash from its Japan business?

    MetLife already uses reinsurance for certain Japan products and is continuing that approach rather than changing it. — John McCallion

  11. 0:48:43 · Wilma Burtis, Raymond James · Variable investment income

    How did private equity and venture capital contribute to variable investment income, and what is expected for the fourth quarter?

    Venture capital funds returned above 8% and the overall portfolio more than 4%, and management assumes a $400 million fourth-quarter run rate with year-to-date VII near $1.5 billion. — John McCallion

  12. 0:51:00 · Wilma Burtis, Raymond James · Private equity returns

    Were returns driven by realized exits or valuation marks, and did AI exposure help?

    The quarter had both more realizations and higher marks, and exposure to about 10 managers holding newsworthy AI names helped. — John McCallion

  13. 0:52:25 · Jack Matten, BMO Capital Markets · RIS assumptions

    Does the assumption review change RIS run-rate earnings, and does lower mortality change pricing or hurdle rates on longevity business?

    The review does not change run-rate earnings, and long-term mortality-improvement assumptions, hurdle rates and pricing philosophy are unchanged. — John McCallion, Rami

  14. 0:54:15 · Jack Matten, BMO Capital Markets · MIM flows

    What are the drivers and outlook for MIM net flows and the margin impact of the mix shift?

    MIM won more private mandates than it had outflows, which were mostly in public fixed income, while profit margins and revenue yields rose and the 2027 growth targets are intact. — John McCallion

  15. 0:56:41 · Pablo Singzan, JPMorgan · Pension risk transfer

    Is the pension risk transfer slowdown a deferral to the fourth quarter or to next year?

    Management sees it as timing, with a back-ended pipeline and a few more deals expected in the quarter, and a positive medium-term outlook. — Rami

  16. 0:57:58 · Pablo Singzan, JPMorgan · M&A

    What acquisition targets and criteria is MetLife considering?

    Organic growth comes first, and any deal must clear a high bar versus buybacks, with asset management and group benefits the two areas of interest rather than anything transformational. — Michel Khalaf

Questions

What new partnership did MetLife announce in EMEA this quarter?

MetLife announced a multi-market partnership with Revolut, one of Europe's largest digital banks, to offer an integrated embedded-insurance experience. Management says it is applying lessons from Latin America and EMEA, and soon Asia, under OneMetLife.

Is the slowdown in U.S. pension risk transfer a structural problem?

Management calls it timing rather than a structural change, citing high funding levels, plan sponsor surveys and a back-ended pipeline with a few more deals expected in the quarter. RIS still grew, with adjusted PFOs excluding PRT up 33% on post-retirement benefits and U.K. longevity reinsurance.

How is MetLife using AI?

Management calls AI a force multiplier that helps growth, customer experience and efficiency. It helped hold the direct expense ratio at 11.9% while absorbing PineBridge, which adds roughly 50 basis points.

What acquisitions is MetLife considering?

Management says organic growth comes first and deals must clear a high bar versus buybacks. Asset management and group benefits are the areas of interest, and it says it does not need anything transformational.

How exposed is MetLife to AI infrastructure?

Hyperscaler exposure is $1.6 billion, all investment grade, and data center exposure is $2.5 billion, for $4.1 billion combined. Each is under 1% of the general account, with no delinquencies or impairments.

Transcript

Call recording on YouTube ↗. Official replay ↗. Timestamps jump to the moment.

0:00:00
Operator

Ladies and gentlemen, thank you for standing by. Welcome to the MetLife third quarter 2026 earnings conference call. At this time, all participants are in a listen-only mode. Later, we will conduct a question and answer session. Instructions will be given at that time. As a reminder, this conference is being recorded. Before we get started, I refer you to the cautionary note about forward-looking statements in yesterday's earnings release. And to risk discussed in MetLife's SEC filings.

0:00:33

With that, I will turn the call over to John Hall, Treasurer and Global Head of Relations. Please go ahead.

0:00:42
John Hall (Investor Relations)

Thank you operator and good morning everyone. Welcome to MetLife's third quarter 2026 earnings call. Before we begin, please review the information on non-GAAP measures in our earnings release, in our quarterly financial supplement, and in our earnings call and investor presentations all of which can be found on the investor relations website at metlife .com on the call today are Michel Khalaf president and chief executive officer and john mccallion chief financial officer and head of metlife investment management other members of senior management are also available to participate this morning john will speak to the earnings call presentation we released last night

0:01:27

on our website. An appendix to the deck features disclosures, gap reconciliations, and other information which you should review. After prepared remarks, we will have a Q &A session that ends at the top of the hour. As a reminder, please limit yourself to one question and one follow-up. Now to Michelle.

0:01:49
Michel Khalaf (CEO)

Thank you, John, and good morning, everyone. The third quarter was another excellent quarter under our new frontier strategy. We delivered MetLife's highest adjusted earnings per share quarter ever with top-line growth across all operating segments.

0:02:04

More importantly, the quarter extends a pattern we have demonstrated throughout the year. Broad-based growth, attractive returns, and disciplined capital management. Variable investment income was a significant contributor this quarter, particularly through private equity and venture capital returns. While VII amplified the quarter, it did not define it. We also delivered strong underwriting and volume growth across the enterprise. No single business drove results. That breadth is the central strength of MetLife. Our complementary capital light and capital driven earnings engines allow us to create value in different ways and across different market environments.

0:02:50

Underwriting margins, fees and spread income generate durable earnings and recurring cash flow. We reinvest that cash where MetLife has structural advantages and return excess capital to shareholders. The engines also reinforce one another. Our retirement businesses originate liabilities backed by long-term assets, and we use insurance and third-party capital to support that growth. MetLife Investment Management manages most of the assets, adding fee income and expanding our capital-like earnings. This efficient model helps fuel growth and generate capital to reinvest.

0:03:29

It is a model designed to compound. Two years into New Frontier, the evidence that the strategy is working as intended is increasingly clear. Year-to-date, adjusted earnings per share, excluding notable items, are up 22%, with adjusted return on equity above 17%. The sources of growth vary from quarter to quarter, but the pattern is consistent. Broad-based execution, attractive returns, and strong cash generation. Now to the third quarter numbers. We reported adjusted earnings of $1.8 billion, or $2.78 per share.

0:04:08

That includes $46 million of notable items, primarily from our annual actuarial assumption review. Excluding notable items, adjusted earnings were $1.8 billion, up 17%, and adjusted earnings per share were $2.85, up 22%, both from a year ago. Variable investment income totaled $720 million pre-tax on private equity returns of more than 4 % versus 3 % a year ago. Our direct expense ratio was 11.9%, on track to beat our 12.1 % full-year target.

0:04:48

Productivity is a big driver of that, and AI is a growing part of it. AI is a force multiplier for us. It's helping us grow, improve customer experience, and operate with greater speed and precision, all while holding down our ratio as we absorb the acquisition of Pinebridge investment, a structurally higher expense business. Adjusted return on equity, excluding notable items, was 19.6%, well above our full year 15 to 17 % target range. This is what compounding looks like.

0:05:21

We earn a high return on equity, return capital to shareholders, and still grow adjusted book value per share up 5 % from a year ago to $59.41. cents. Turning to the performance of our businesses, starting with group benefits, adjusted earnings were $523 million, excluding notables, up 14%. Life underwriting was favorable as broad-based improvement in working age mortality continues. The group life mortality ratio was 79.5%, well below our target range. The non-medical health ratio was 72.3%, just below the midpoint of our target range.

0:06:05

On an adjusted basis, our premium fees and other revenues, or PFOs, increased 5 % when you exclude participating contracts, with sales up 12 % year-to-date. In my view, group benefits is the most attractive segment of U .S. life insurance, and MetLife is far and away best in class across the widest array of products and markets in the industry. This unparalleled scale translates to above market growth with close to $26 billion of annual PFO. And these capital-like PFOs turn into adjusted earnings with a high free cash flow conversion ratio.

0:06:45

Moving to Retirement and Income Solutions or RIS, adjusted earnings excluding notable items were $478 $1 million, up 12% on higher investment margins and volume growth. Adjusted PFOs excluding pension risk transfers increased 33%, driven in part by UK longevity reinsurance, and retained liability balances were up 7%. While U .S. pension risk transfers activity has been lighter this year, we see this as timing, not a structural change. High funding levels provide plan sponsors with execution flexibility relative to timing and structure, and the intent to do risk remains strong.

0:07:26

All key observations from our annual pension risk transfer poll of plan sponsors. And this highlights a core strength of our retirement business, its diversified multi-channel and multi-product breadth. Alongside PRT, we are a leader across UK Longevity RE, UK Funded RE, structured settlements, stable value, corporate-owned life insurance, and we have a growing presence in U .S. retail annuity reinsurance. Our broad scope and leading positions mean we are not reliant on any single retirement market, and we're able to pivot to those opportunities that represent the highest and best use of our capital.

0:08:05

In Asia, adjusted earnings excluding notable items were $550 million, up 21 % on a constant currency basis. Results benefited from higher VII and favorable equity markets performance. Adjusted PFOs rose 5 % on a constant currency basis, with Korea continuing to show strong momentum. In Latin America, adjusted earnings were $229 million, excluding notable items. The result was impacted by market conditions in Chile, resulting in a negative NCAHE return. What stands out here is our momentum. Adjusted PFOs grew 14 % on a constant currency basis, led by Mexico and Chile.

0:08:50

As the number one life insurer in Latin America, we reach about 30 million customers across group, agency, and direct channels, including our accelerator-embedded insurance platform. In EMEA, adjusted earnings were $114 million, excluding notable items, up 30%. This was above the $90 to $100 million quarterly run rate we've discussed, driven by volume growth. Adjusted PFOs grew 17 % on a constant currency basis. Embedded insurance is working here too. Our new multi-market partnership with Revolut, one of Europe's largest digital banks, offers a seamless integrated customer experience.

0:09:33

This is part of a larger story on MetLife being able to leverage its capabilities on a global scale. We're applying the digital lessons we've learned and the capabilities and experience we've built in Latin America, in EMEA, and soon Asia as well, demonstrating the power of OneMetLife. At McLife Investment Management, or MEM, adjusted earnings were $63 million, up 9 % and 19 % year-to-date, reflecting the addition of Pinebridge and sequential profit margin expansion. No single business carried the quarter.

0:10:07

Group led on underwriting, RIS and Asia on investments, Latin America and EMEA on top-line growth. This is diversification at work, and it underscores the all-weather nature of our results. Against a favorable backdrop for the life insurance industry, including higher rates, stable credit, and rising demand for retirement products, our strong capital position gives us multiple attractive avenues for growth. It all starts with our steady recurring capital generation and free cash flow and our disciplined framework for deploying.

0:10:42

Organic growth comes first, where we have structural advantages and can earn attractive risk-adjusted returns. We hold every dollar deployed to support new business to a strict return standard, and we track the value it creates, VNB, or the value of new business. We have done this consistently for more than a decade. At the start of this journey 10 years ago, we put $2.9 billion of capital to work at an internal rate of return of 12 % and a payback period of eight years.

0:11:12

Fast forward to last year, where we deployed $3.8 billion at an IRR of 19 % and a payback of five years. More capital deployed at a higher IRR with a faster payback. That discipline has been compounding, and it is showing up in our rising return on equity. After funding attractive organic growth, we consider acquisitions, but only when they add a strategic capability and meet our stringent financial criteria. A deal has to earn at least as much as we earn by investing in our own business or buying back our shares.

0:11:49

Beyond those opportunities, we consistently return excess capital to shareholders. In the third quarter, we repurchased $650 million of our common shares and another $265 million in October. Year-to-date, that brings total capital return to shareholders to roughly $3.5 billion through both buybacks and common stock dividends. Liquidity remains strong, withholding company cash and liquid assets totaling $3.4 billion at quarter's end. To close, the recurring revenue model on the new frontier is firing on all cylinders.

0:12:26

We have market-leading businesses, two complementary earnings engines, and a disciplined approach to capital allocation. Together, they produce durable earnings, recurring free cash flow, and multiple avenues for profitable growth. We regularly pressure test our strategy with our board of directors, including an in-depth review during the third quarter. That work reinforced our conviction in New Frontier and in MetLife's standing as a quality compounder. a company capable of delivering differentiated earnings growth, attractive returns, and consistently returning capital to shareholders.

0:13:05

This was a record quarter, but the more important point is the pattern behind it. The model is working, the breadth of growth is increasing, and we are executing with discipline. With that, I'll turn it over to John to walk through the results in more detail.

0:13:23
John McCallion (CFO)

Thank you, Michelle, and good morning, everyone. As Michelle outlined, we continue to see strong momentum across the enterprise, and what stands out is the quality of that growth. We're generating attractive returns, maintaining expense discipline, and deploying capital into opportunities that create long-term value.

0:13:40

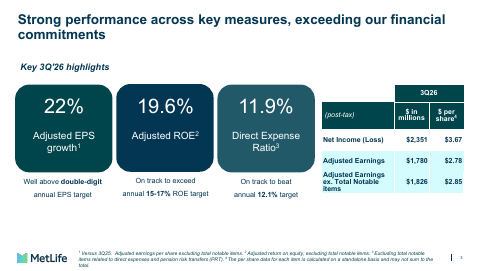
Those are important characteristics of our model. They allow us to invest in growth, generate strong free cash flow, and return excess capital to shareholders, all while maintaining a strong balance sheet. I'll walk through the third quarter results and then spend some time on several proof points behind that performance, including our expense discipline, returns we're generating on new business, the quality of our investment portfolio, and our cash and capital position. Starting on page three, we again exceeded our key financial commitments.

0:14:13

Adjusted EPS, excluding notable items, grew 22%, well above our double-digit target. An adjusted ROE excluding notables was 19.6%, on track to exceed our annual 15 % to 17 % target range. Our direct expense ratio was 11.9%, keeping us on track to beat our 12.1 % annual target. And importantly, these results build on strong performance throughout the year. Year-to-date adjusted EPS excluding notable items is up 22%, and adjusted ROE is above 17%.

0:14:50

For the quarter, net income was $2.4 billion, or $3.67 per share. Adjusted earnings were $1.8 billion, or $2.78 per share. Net income exceeded adjusted earnings by about $570 million, mainly due to a non-economic accounting gain following the rise in interest rates in the quarter. The balance of the difference reflects net investment losses including normal trading activity partially offset by market risk benefit gains and our credit outlook remains stable. Turning to page four, let me provide some additional detail on the notable items Michelle referenced.

0:15:34

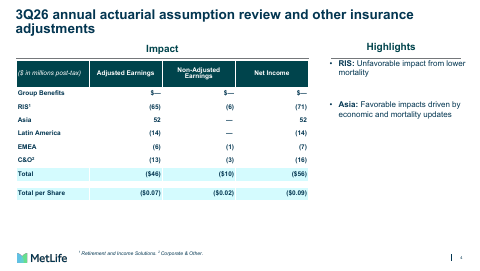
As we do each third quarter we completed our annual global actuarial assumption review which had a modest overall impact. This review together with other insurance adjustments shown on page four reduced adjusted earnings by $46 million or seven cents per share. Retirement and Income Solutions or RIS had an unfavorable impact due to lower mortality which was largely offset by favorable economic and mortality updates in Asia. Now let's look at the underlying business performance on page five and all comparisons here are year-over-year and exclude total notable items.

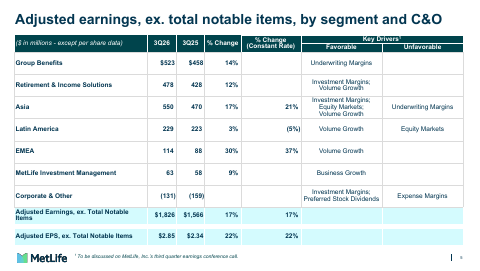
0:16:11

Adjusted earnings increased 17 % to $1.8 billion driven by higher variable investment income or VII, volume growth, and favorable underwriting. Higher expenses, mainly employer-related costs, were a partial offset. Adjusted EPS grew 22 % to $2.85 supported by disciplined capital management. Starting with group benefits, adjusted earnings were $523 million, up 14%, primarily driven by favorable underwriting. The group life mortality ratio was 79.5%, below our 2026 target range of 83 to 88%, and better than the 83.4 % a year ago.

0:16:56

Mortality among the working age population remained favorable. In non-medical health, the interest adjusted benefit ratio was 72.3 % within our 70 to 75 % target range. It improved 160 basis points from the last quarter, consistent with seasonal dental utilization. Growth also remained healthy. Adjusted PFOs rose 3 % or 5 % excluding participating contracts. And year-to-date sales were up 12%, driven by strong performance in both national accounts and regional business. In RIS, adjusted earnings were $478 million, up 12%, driven by higher investment margins and volume growth.

0:17:43

Stronger private equity returns lifted the total investment spread to 130 basis points above our 100 to 120 basis point guidance range. COURSE SPREAD, EXCLUDING VII, WAS 99 BASIS POINTS IN LINE WITH EXPECTATIONS. ADJUSTED PFOs EXCLUDING PENSION RISK TRANSFERS ROSE 33%, MAINLY DRIVEN BY HIGHER SALES OF POST RETIREMENT BENEFITS AND UK LONGEVITY REINSURANCE. TOTAL RETAINED LIABILITY EXPOSURES GREW 7 % ABOVE OUR 3-5 % OUTLOOK RANGE. GIVEN THE STRENGTH OF THE BUSINESS YEAR TO DATE AND ASSUMING NORMAL VII IN THE FOURTH QUARTER, We expect full-year RIS adjusted earnings to finish slightly north of the midpoint of our $1.6 to $1.8 billion outlook range.

0:18:34

Asia delivered adjusted earnings of $550 million, up 17%, or 21 % on a constant currency basis. Higher VII was the primary driver. Favorable equity markets and volume growth also contributed to the strong result. help. These benefits were partially offset by less favorable underwriting against a particularly strong prior year quarter. General account assets under management at amortized costs were up 4 % on a constant currency basis. Asia's sales declined 6 % on a constant currency basis against a strong prior year comparison.

0:19:10

However, year-to-date sales are up 10 % on a constant currency basis, led by Japan and Korea. In Latin America, Adjusted earnings were $229 million, up 3 % or down 5 % on a constant currency basis. Strong volume growth was largely offset by a weaker in CAHE return of negative 3 % compared with a positive 6 % in the prior year period, which created a year-over-year headwind of about $30 million. Top-line momentum remained strong and broad-based across the region, with adjusted PFOs up 22 % or 14 % on a constant currency basis, and sales were up 6 % on a constant currency basis.

0:19:57

EMEA adjusted earnings increased 30 % to $114 million or 37 % on a constant currency basis driven by volume growth. EMEA's continued expansion drove adjusted PFO growth of 14 % or 17 % on a constant currency basis. supported by strong sales momentum and solid renewal activity. Sales rose 16 % on a constant currency basis. As the business scales, growth is translating into increasingly consistent and durable earnings. At MetLife Investment Management, or MIM, adjusted earnings were $63 million, up 9%, reflecting business growth, including the addition of Pinebridge.

0:20:41

range. Total AUM was $723 billion, up 14%, including institutional client AUM of $308 billion, up 45 % from a year ago. Total AUM declined $25 billion sequentially, primarily reflecting higher rate mark-to-market impacts on public fixed income. We remain on track for full-year adjusted earnings within our $240 to $280 million target range. Finally, Corporate and Other reported an adjusted loss of $131 million compared with a $159 million loss a year ago. Higher VII and lower preferred dividends following last year's redemption of the Series G preferred stock more than offset higher employer-related costs.

0:21:32

The company's effective tax rate on adjusted earnings in the quarter was 23%, modestly below our 2026 guidance range of 24 to 26%. On page six, we provide a five-quarter view of pre-tax VII. At $720 million in the third quarter, VII was well above our implied quarterly guidance of $400 million. dollars. As we anticipated last quarter, stronger private equity returns drove the outperformance. Average returns were 4.2 percent, led by venture capital reflecting strong IPO activity and public market valuations.

0:22:14

As a reminder, private equity in real estate and other funds are reported on a one-quarter lag and mark-to-market. Year-to-date VII is approximately 1.5 $1 billion putting us on course to exceed our full year guidance of approximately 1.6 billion page 7 shows how post-tax vii is distributed across the business segments and corporate another as of september 30th total vii assets were 18.8 $1 billion with 48 in asia 26 in RIS and 22 % in corporate and other.

0:22:51

Each business has its own discrete portfolio constructed to align with the long-term nature of their obligations. On page 8, our third quarter direct expense ratio was 11.9 % compared with 11.6 % a year ago and 11.7 % for the full year 2025. Year-to-date, the ratio is 12%, below our 12.1 % target, even as we absorb roughly 50 basis points from Pine Bridge. Strong PFO growth and continued expense discipline, including AI and technology-driven productivity gains, are helping offset higher employer-related costs.

0:23:32

We manage expenses on a full-year basis and remain on track to beat our target. Let me turn to page nine because this gets into an important part of our capital allocation story. Not simply how much we grow, but the value we create from the capital we deploy. In 2025, we deployed $3.8 billion of capital and generated $2.8 billion of value of new business, or V &B, up 8 % from 2024. With new business premium growth in every segment.

0:24:07

For the third straight year, we achieved a 19 % internal rate of return and a five-year payback. Compared with 2021, that's two points better on IRR and one year faster on payback. And over that period, V &B grew 50 % from $1.9 billion to $2.8 billion, while capital deployed increased by only about one-third from $2.8 billion to $3.8 billion. So we're generating more value from each dollar of capital deployed. That's the capital efficiency we're focused on.

0:24:42

It also creates a reinforcing cycle. Attractive returns and faster payback support capital generation. That capital can then fund the next round of attractive growth or be returned to shareholders. Adjusted ROE excluding notables is above 17 % year-to-date. And last year's free cash flow ratio exceeded the top end of our 65 to 75 % target. Our approach is straightforward. We lean into opportunities when returns clear our hurdles, and we remain disciplined when they don't. The same focus on risk-adjusted returns applies to our investment portfolio.

0:25:20

I want to spend a moment on our exposure to AI-related infrastructure, given the increasing attention this area is receiving. On page 10, starting on the left, our hyperscaler exposure totals $1.6 billion. Most of it, $1.4 billion, is public fixed income, and the other $200 million is private fixed income. The entire hyperscaler exposure is investment grade, with an average rating of AA3 and a weighted average life of approximately 17 years. On the right, our data center exposure totals $2.5 billion.

0:25:54

About half, $1.3 billion, is private fixed income, followed by public fixed income of $1 billion, and real estate is approximately $200 million. Over 95 % of the fixed income is investment grade, and the weighted average life is about four years. Combined, our exposures total $4.1 billion. Each category represents less than 1 % of our general account. making this a modest exposure relative to the overall portfolio. And importantly, we have no delinquencies or impairments in either category.

0:26:29

The takeaway is that these are high-quality, diversified exposures, and modest relative to our balance sheet. As the opportunity set evolves, we'll continue to apply the same disciplined underwriting and risk-adjusted return standards we use across the portfolio. Now let's turn to capital and liquidity on page 11. We continue to operate from a position of strength, giving us the flexibility to fund attractive growth while returning excess capital to shareholders. As of September 30th, holding company cash in liquid assets totaled $3.4 billion within our $3 to $4 billion target buffer.

0:27:07

We return approximately $1 billion to shareholders in the third quarter, including $380 million of common dividends and $650 million of share repurchases. In October, we repurchase another $265 million of shares, bringing year-to-date share repurchases through October to $2.4 billion. dollars. Our capital allocation framework remains consistent and our strong capital and liquidity gives us the flexibility to execute against it. For our U .S. companies, we estimate total statutory adjusted capital on an NAIC basis of approximately $17 billion as of September 30th, up 3% from June 30th.

0:27:51

Finally, in Japan, our economic solvency ratio or ESR was 192 % for the fiscal year ended March 31, 2026. That's just above the top end of the 170 to 190 % range we previously discussed. Let me close with three takeaways. First, this quarter reinforces the quality and the breadth of our growth. We delivered strong underlying performance across the enterprise. and our diversification continues to give us multiple sources of earnings growth. Second, we're focused on making the growth increasingly valuable.

0:28:31

Our expense discipline, strong returns on new business, and improving capital efficiency are helping translate growth into higher returns and strong cash generation. And third, our balance sheet and liquidity give us the flexibility to keep investing where we see attractive opportunities while continuing to return excess capital to shareholders. Taken together, that is how we see New Frontier creating long-term value. Durable growth, attractive returns, disciplined capital deployment, and the financial flexibility to keep compounding. We're pleased with our progress and confident in our ability to deliver on our 2026 commitments and our longer-term objectives.

0:29:16

With that, I'll turn the call back to the operator for your questions.

0:29:21
Operator

We will now begin the question and answer session. Please limit yourself to one question and one follow-up. If you would like to ask a question, please press star 1 to raise your hand. To withdraw your question, please press star 1 again. We ask that you pick up your handset when asking a question to allow for optimum sound quality. And if you're muted locally, please remember to unmute your device.

0:29:50

Please stand by while we compile the Q &A roster. Your first question comes from the line of Ryan Kruger from KBW. Your line is open. Please go ahead.

0:30:01
Ryan Kruger (KBW)

Hey, thanks. Good morning. Start with non-medical health. Can you unpack the loss ratio you saw in the quarter a little bit more between disability and dental? I'm sure you've seen that many companies in the industry have seen weaker disability results. So I wanted to understand how that impacted MET and then separately what you saw in dental.

0:30:28
Rami (Executive)

Good morning, Ryan. It's Rami here. Let me just begin by saying for the quarter, we're really pleased with our overall group results, solid year-over-year growth, both in top line and bottom line. So our non-medical health ratio is a part of that. And as you stated, it does include disability. That number, as you see, is right in the middle of our guidance range as well. So let me just unpack that for you and specifically start with disability.

0:31:01

We saw some puts and takes in the quarter with disability. We saw a slight increase in severity. We had offsetting items there, inclusive of very strong recoveries in terms of claims closures. And that's a direct result of the investments we continue to make there. So we're really pleased with the results there. Overall, incidents do remain broadly in line with our expectations. Coming into 26, we did expect and plan for an uptick in incidents. And we did see an increase in claim submissions and in particular we did see an increase in mental nervous claims over the course of the year.

0:31:43

But again, overall the results are broadly in line. And as you kind of look forward and think about disability and the broader non-medical health ratio, look, disability is a line that could be impacted by the macro environment. We will continue to monitor this carefully and continue to be proactive in terms of putting all the right levers in place to stay within our target margins. And you saw us do that this year. The other point I would make, and just to add to the dental piece, is diversification matters.

0:32:16

So we are benefiting from the actions, pricing, network growth that we've done on dental in terms of our loss ratio there. and disability is about 15 % of our premiums. So when you put all of that together, we feel we're really well positioned going into the future.

0:32:38
Ryan Kruger (KBW)

Thanks. And then one on expenses, I think they were somewhat impacted negatively by stock compensation from your stock move. Can you size that at all? Just to help us understand how that impacted results.

0:32:58
John McCallion (CFO)

Hey, hey, Ryan, it's John. Good morning. It was a probably maybe a point or two on the expense ratio. So overall, like you said, we've had an increase in incentive comp going into the quarter. So it's probably, like I said, probably a point or two on the expense ratio is probably the best guide. Okay, thanks. Good problem to have.

0:33:26
Operator

Your next question comes from the line from Sunit Kama from Jeffries. Your line is open. Please go ahead.

0:33:35
Sunit Kama (Jefferies)

Thanks. Good morning. Just on group life, you know, we've seen this working age mortality phenomenon, you know, continue to benefit the industry as a whole and you guys as well. Is your sense that, and again, I think we've talked about this in the past that some of it could be COVID pull forward and those types of things, but is your sense that we're sort of running it's run its course at this point or or would you expect that this favorability you know could continue and at what point does it sort of get factored into pricing thanks

0:34:07
Rami (Executive)

hey Sinead it's Rami good morning um look it's very hard to predict this um there are different potential drivers for the favorability there's

0:34:15

the pull forward effects and there are other kind of contributors there But the way I would think about it as it translates to our financial results is this is a competitive market. And should these trends continue, we would expect the favorability to gradually normalize over time, but gradually being the operative word here. We have a business, largely national accounts, skewed, and the renewal cycle is three to five years. So think about this gradual normalization happening over the period of years versus quarters.

0:34:51

The other point I'll just make for you is we've had a really good outcome this year. It wasn't just all population. We had a mild flu season in Q1. We had now two quarters of lower severity, which I would not necessarily trend. So looking at the very near term, think Q4 and Q1, we would expect a seasonal uptick in both of those quarters largely driven by normal flu seasonality. So think about that as the short-term dynamic and juxtaposed with the long-term dynamic that I just talked about earlier.

0:35:29
Sunit Kama (Jefferies)

Okay, that's helpful. And then I guess for John on the VNB stuff, if we track this over a little bit of a longer period than you show on your slide, I think you're up maybe 500 basis points in terms of IRR over the past 10 years. And I guess I'm wondering if you've done any work on sort of what the components of that improvement or what the drivers have been, how much of it has been interest rates, how much have been mixed, how much have been cost, just to get a sense of how sustainable the current levels are.

0:36:01

Thanks.

0:36:02
John McCallion (CFO)

Yeah, thanks for the question, Sunita, John. Yeah, it's hard, it's hard probably to be really precise around that. You are right, it's probably 500 basis points, maybe even plus, but in the, if you compare to when we ultimately started the first time. I would say the, you know, if we step back and think about what was the biggest driver, it was putting the tools into the hands of our leaders to make good decisions holistically around things like product design, like you said, expense management, because you see the power of unit costs and the present value of those benefits coming through.

0:36:40

Interest rates are a component, to your point. So we have seen an aspect of that. So I would probably feel pretty balanced around all those things in terms of what the contributions have been. But I think overall, PROBABLY, LIKE I SAID, THE MOST IMPORTANT THING HAS BEEN CULTURALLY AND FROM A DNA PERSPECTIVE, GETTING THOSE TOOLS AND THE VALUE-DRIVEN MENTALITY INTO THE HANDS OF OUR LEADERS HAS BEEN PROBABLY THE BIGGEST DRIVER OF THE CHANGE.

0:37:13
Sunit Kama (Jefferies)

SO PRESUMABLY PRETTY SUSTAINABLE THEN.

0:37:16
John McCallion (CFO)

YES, WE BELIEVE SO. AND I THINK THE OTHER THING TO HIGHLIGHT IS, YOU KNOW, WE 'VE ALSO SEEN kind of our mix and we've talked and Michelle opened with this around and kind of how we're talking about these two complementary engines and you know we've seen a growing mix of capital light we still favor our capital driven businesses and and we feel like there's good driven growth opportunities there as well but from a mixed perspective we are seeing a higher ROE group of businesses take a higher proportion of our earnings and then also remember we have you know we've been there's been an accelerated runoff of our legacy retail business which has a lower ROE.

0:37:57

So all of those things are factoring into the sustainability. Okay, thanks.

0:38:02
Operator

Your next question comes from the line of Tom Gallagher from Evercore ISI. Your line is open. Please go ahead.

0:38:11
Tom Gallagher (Evercore ISI)

Thanks. First question for Rami. How do you see this pricing for disability situation playing out given recent competitor elevated claims? You mentioned your own claims are a bit elevated because claims are elevated, but the ROEs in the business are still very good, I believe. Should we think about it as maybe a soft market neutralizing on pricing, or do you think this actually hardens the market and we start to see rate increases here?

0:38:50
Rami (Executive)

Thanks, Tom. I think, look, as an industry, we always said and we still see this to be a competitive but rationally priced industry. So whenever you see an uptick in trend, we have seen the industry react and look to get back to its target margins. And a lot of that is driven by the very short-tailed nature of the business and the ability to reprice. and we are a market leader here and we continue to lead the way.

0:39:22

So you saw us do that in dental last year. You saw us coming into this year with an expectation of rising incidents after what has been a few good years and we baked that into our plan. We baked that into trend. And so that's kind of part of how we approach this. The other piece I would say when we look at it, the power of diversification for us is really important, right? And that means that when we look at an account-by-account basis, we typically have a bundle.

0:39:56

We don't have a single product. And we're therefore able to make the bundle attractive, get the right economics at an account level, and get those rate increases that we need, be it in disability or other lines. So this is very much a strategy that is sitting at the account level. But again, to your overall question, we think pricing will reflect experience. We certainly have been planning for an additional uptick in trend in disability and are also planning for that next year.

0:40:30

And that's reflective in our pricing and rate actions.

0:40:34
Tom Gallagher (Evercore ISI)

Gotcha. Thanks for that. But follow up, John, can you comment at all where you stand on capital management as it relates to potential risk transfer deals with MetLife Holdings or potential reinsurance with Chariot Re? Any updates or where do you see that market evolving for you?

0:40:56
John McCallion (CFO)

Yeah, I think, you know, I would say things haven't changed, broadly speaking, when it comes to risk transfer or leveraging Chariot. I'd say just on the Chariot side, we continue to progress.

0:41:13

We actually just, you know, had another deal close at the, you know, the end of the quarter. And, you know, again, if you just step back and think about what we're trying to accomplish there, we see a lot of attractive opportunities to grow our retirement businesses. We can do that by leveraging third-party capital. That third-party capital can result in additional MIM fees for us. So we are still looking at Chariot as a strategic growth opportunity for us.

0:41:39

You know, on the risk transfer side, and maybe I'll have Rami, you know, share some insights just from his perspective. But I would say nothing has changed from our perspective. We continue to look and talk with third parties. but at the same time where we have no burning platform to have to do anything. But if we see good opportunities out there and we do see markets continuing to evolve, then we would look to take advantage of that.

0:42:07

I don't know if you want to add anything, Ryan.

0:42:10
Rami (Executive)

No, I think you've captured it well, John. Nothing to add here. Thanks.

0:42:15
Operator

Your next question comes from the line of Wes Carmichael from Wells Fargo. So your line is open. Please go ahead.

0:42:22
Wes Carmichael (Wells Fargo)

Hey, thanks. Good morning. Just the first one on RIS spread. I think the base spread kicked down maybe a basis point to 99 basis points in the quarter. But, you know, long-term rates have been a little bit more volatile recently.

0:42:36

So I'm just wondering how you're seeing base spread trending from here.

0:42:40
John McCallion (CFO)

Yeah. Good morning, Wes. It's John. You know, just maybe start with overall, obviously we're above the range in total. We're at 130 basis POINTS IN THE QUARTER. SO, YOU KNOW, UP SEQUENTIALLY AND CERTAINLY THE VII DROVE THE BEAT. WHILE COURSE SPREAD REMAINED VERY STABLE WITHIN OUR 95 TO 100 THAT RANGE THAT WE 'VE REFERENCED IN THE PAST. YOU KNOW, AND THEREFORE IN LINE WITH EXPECTATIONS.

0:43:08

YOU KNOW, WE, YOU KNOW, WHILE RATES HAVE BEEN VOLATILE, I THINK, YOU KNOW, WHAT WE 'VE TALKED ABOUT IS THAT WE 'VE WE SEE WE CONTINUE TO see stability in the spread. And probably that would be our sense for fourth quarter as well. We still believe on a core basis that we should be within the 95 to 100 so that stability will remain. And then from a VII perspective, we're assuming we'd get back to the normal 400 million run rate.

0:43:34

So we would be within the 100 to 120 come 4Q for RIS.

0:43:39
Wes Carmichael (Wells Fargo)

All right. Thanks, John. And just maybe a higher level question on capital, and maybe it ties into the V &B and payback period discussion. But just looking forward, I'm wondering if you're seeing the direction of travel for pre-cash flow conversion changing at all. I know you have your two-year target of 65 % to 75 % of pre-cash flow conversion. Just wondering if you're seeing that change in the business or if you're thinking about investing more into organic growth given the opportunity set

0:44:09
John McCallion (CFO)

yeah i think to to your point um maybe a few factors to consider uh one you know well let me just start

0:44:17

with we we still feel comfortable with our 65 to 75% uh range that we've provided i think the other thing to highlight though is that you know we've seen good growth across all our businesses uh and to your point we want to kind of maintain that growth we think we can maintain and support that strong, healthy breath of growth that we have while maintaining our 65 to 75 % free cash flow ratio. And I think if you look back, I'd say our growth rate right now as a firm is incrementally stronger in totality.

0:44:50

Obviously, we have less of a runoff business than we used to have. I think all the businesses are generally performing performing well across the board. So I think if you take that all into context, you know, capital generations is probably stronger, but our growth is also higher and we're still maintaining our 65 to 75% free cash flow ratio.

0:45:16
Operator

Thank you. Your next question comes from the line of Alex Scott from Barclays. Your line is open please go ahead

0:45:25
Alex Scott (Barclays)

hey good morning um wanted wanted to start on expenses you know appreciate you guys have been uh outperforming the expense ratio guidance that you've that you've thrown out there um yeah how do you see that progressing as we think through

0:45:43

you know heading into 2027.

0:45:45
Michel Khalaf (CEO)

yeah hey hey alex that's michelle uh yeah you're really pleased with the continued expense discipline, I would say, that we're seeing. And keep in mind that we've had to absorb a higher expense business in Pinebridge this year. That's about 50 basis points. And yet we're expecting to come in below the 12-1 target for this year. and you know we're seeing benefits here from investments we've made in technology AI in particular has been I would say a force multiplier will continue to do so as we move forward here and it's helping us both on the efficiency front as well as on the on the growth and revenue front as well which is why we like

0:46:38

you know the expense ratio direct expense ratio as a proxy in terms of the progress we're making on that front as well. So all in all, I would say there's good inertia here. And so, you know, as we look forward, I think, you know, we see opportunity to continue to drive that ratio down. For the time being, we are sticking with the 11-3 ratio that we, uh you know talked about at investor day uh and you know uh that's the 20 29 ratio uh but uh you know and and if we need to update things we'll we'll keep you posted uh

0:47:23
Alex Scott (Barclays)

great that's so helpful just japanese uh businesses cash flow um you know obviously the esr is in

0:47:31

a healthy spot but could you talk a bit about just the cash flow you're seeing from that business and you know we've seen some other companies ramp up reinsurance to you know provide a little bit more cash out of the japanese business as well so do you have any opportunities there to do reinsurance

0:47:51
John McCallion (CFO)

Yeah. Hey, hey, Alex, it's John. I'll take that one real quickly. Yeah, first, and maybe I'll let Lyndon comment on just, you know, the growth, but we've seen great growth in that business.

0:48:03

And, you know, you look over the last few years and, you know, how that business has continued to drive through innovation and the distribution network we have. It's been, it's been really, really strong and incredible. Having said that, you know, we do leverage reinsurance as well internally and we have been doing that so this is we're really not changing tact we're kind of staying the course so you know in times we leverage for certain products reinsurance and other ones you know we don't and so I wouldn't say there's any opportunity to change what we're doing is a continuation of what we're doing.

0:48:43
Operator

Thank you. Your next question comes from the line of Wilma Burtis from Raymond James. Your line is open. Please go ahead.

0:48:52
Wilma Burtis (Raymond James)

Hey, good morning. Could you break down the terms in the quarter between private equity and venture capital? If you We can also provide the balances that would be helpful as well. And maybe give us any indication of what you're thinking in the 4Q on the VII side. Thanks.

0:49:15
John McCallion (CFO)

Good morning, Wilma. Hi. Yeah, let me just start with maybe just a step back first.

0:49:22

I think what's really important to remember here is that private equity is, you know, it's been a long-term allocation for us to match up with our longer-term liabilities. So this really hasn't been a quarterly trade kind of mentality, right? This is a portfolio that's well diversified across 700 funds, 200 managers, across strategies and vintages. And, you know, overall, just from a percentage perspective, our VC portfolio makes up about 25 % of our PE portfolio.

0:49:51

And, you know, we've been a steady investor for decades. And so, you know, I think the highlight and the takeaway here is Q3 really shows the payoff of that approach overall. From an overall return perspective, I think in the quarter, we saw an actual return in VC funds above 8%. So it was a very strong return in the quarter. But other funds performed well too. I think on average, the portfolio had over 4 % return and so others were above plan as well.

0:50:25

As we look forward, certainly year to date, we're at about $1.5 billion. So we expect to be above our $1.6 billion guide that we provided as part of the Outlook call. But at this juncture, we don't really have much better information other than to assume that we'll stick to our quarterly run rate of $400 million for 4Q. And as we get closer, as we've done in the past, we'll also provide an early disclosure around where we are come the end of the quarter.

0:51:00
Wilma Burtis (Raymond James)

And then both within the VC portfolio and the private equity portfolio, could you just talk about the recent performance and how much has been driven by realized exits versus, I guess, marks or increases in valuation? And in any color, I guess, on potential AI exposure upside, whatever however however you want to disclose that but um any thoughts on the ai impact on those returns thanks

0:51:25
John McCallion (CFO)

yeah i'll um you know generally the way it works is the marks are what drive and then you have realizations within the quarter that realize the marks um so i would just say at the highest level we had more realizations this quarter than any other quarter that's maybe i'll just start with i don't have

0:51:46

the exact number of percentages but we were backed we had a higher level of realizations but we also had a higher level of mark to market in the quarter um so uh so i think you know we are starting to see realizations pick up which is a good sign i also think that has helped some of the performance in uh in the portfolio at the same time we were beneficiaries of many of what you referenced in the portfolio we have probably across a good 10 managers exposure to some of the newsworthy names that are out there on AI.

0:52:25

And so that was a, that certainly was a benefit in the quarter.

0:52:30
Operator

Your last question comes from the line of Jack Matten from BMO Capital Markets. Your line is open. Please go ahead.

0:52:39
Jack Matten (BMO Capital Markets)

Hey, good morning. First one on RIS, I have two parts. First, is there any change to run rate earnings coming out of the assumption review? And secondly, for the more longevity-focused business lines, is the lower mortality experience that you've seen change anything regarding either return hurdles or pricing on new business?

0:53:05
John McCallion (CFO)

Yeah, I can take the first, Jack. It's John. THANKS FOR THE QUESTION. I THINK REAL QUICKLY, NOTHING FROM THE ACTUARIAL ASSUMPTION REVIEW WOULD CHANGE ONGOING RUN RATE. AND I THINK YOU CAN SEE WHERE WE'RE HEADED. AND ALSO WE 'VE PROVIDED YOU A GUIDE IN TERMS OF WHERE WE LOOK TOWARDS FOR THE FULL YEAR AND THE FOURTH QUARTER, WHICH IS INDICATIVE OF WHAT WE BELIEVE RUN RATE IS THERE. SO I 'LL TURN IT OVER TO RAMI FOR THE SECOND QUESTION.

0:53:33
Rami (Executive)

Yeah, good morning, Jack. In terms of just the pricing, you know, look, we had a modest actuarial assumption review here in RIS, driven by kind of what we do on an annual basis. It's a true up of our baseline assumptions. If you look at the reviews over the last four years, we saw both favorable and unfavorable adjustments. The actual net number in aggregate was favorable. Our long-term assumptions, which include mortality improvements over time, have not changed, and there's kind of no change in our hurdle rates, if you will, or our pricing philosophy here.

0:54:15
Jack Matten (BMO Capital Markets)

Makes sense. Thanks. Thanks. The second question is on MIM. Any covered on drivers of net flows and your outlook for flows or your pipeline into the coming quarters? And in terms of the mix of inflows versus outflows, any meaningful difference in the feed rate or margin profile of the current mix shift there?

0:54:36
John McCallion (CFO)

Hey, Jack, it's John again. Thanks for the question. Let me just start with, we are very pleased with the progress that the team's been making integration execution.

0:54:48

We've launched the one-brand, one-mem brand platform over the summer. So very pleased overall. And we have seen while some early results were affected by the transaction related, you've seen some revenue dissynergies and some mark-to-market. As we talked about in the opening remarks, the earnings are up 19 % year-to-date. We've seen earnings building every quarter and we expect that to continue. We've seen margins expand in terms of profit margins sequentially. And also if you kind of take a quick, a closer look, you've seen a more profitable mix emerging and the revenue yields are up.

0:55:27

On top of that, we've seen the integration you know, accelerate. And so we've seen some expense synergies get materialized and realized in the you know throughout the year so you know overall uh one on the integration performing well on a commercial side i would say momentum is strong um we've actually even though we had some outflows on the on the roll forward there um we've had uh we've won more private mandates than we've had outflows in the quarter so obviously the private mandates do um do lag because the uh the AUM builds as those assets are deployed.

0:56:05

So that was in both our private fixed income and our private credit areas. But in terms of the outflows, those are generally been in more of the public fixed income area. So I think overall, if we step back, as we said in the opening remarks, we expect to be within the range this year and our confidence in hitting our 2027 growth targets remains the same. Thank you.

0:56:35
Operator

Your next question comes from the line of Pablo Singzan from JP Morgan.

0:56:41

Your line is open. Please go ahead.

0:56:43
Pablo Singzan (JPMorgan)

Hi, thanks for speaking me. And so early in the call, I think Michelle has made some comments about PRD timing. Are you referring to a deferral to the fourth quarter or do you think it's more likely that deals show up next year? And I guess the context of the questions that some of your competitors have talked about a catch up and fork you but i'm not sure if your appetite aligns it there

0:57:08
Rami (Executive)

uh hey um good morning it's it's rami here um you know i think michelle's comment i'll reiterate it is is broader right so we have a an outlook a medium term outlook for this market that that is positive.

0:57:22

We think this slowdown year-to-date in terms of volume is just timing. When you look at this from a structural perspective, every single indication that we look at, be it in terms of funding levels, be it in terms of the surveys that we do with corporate plan sponsors and their desire to de-risk and exit their pension obligations, all point to a market that still has a lot of runway to go. We, as you know, play in the lumpy end, the jumbo end of the market, which is always going to be lumpy.

0:57:58

So we're coming off a year last year where we did $14 billion of PRTs. We do have a back-ended pipeline this year. We've got a few more deals coming in the quarter. But I would say just if you step back, we still see a really positive outlook and momentum for the business, given all the structural reasons I mentioned.

0:58:22
Pablo Singzan (JPMorgan)

Thanks, Rami. And then second question. M &A is just more topical than life insurance these days for various reasons.

0:58:30

So I guess, can you remind us about what assets you might be interested in buying and sort of the general lens you use in evaluating opportunities?

0:58:40
Michel Khalaf (CEO)

Yeah. Hey, Pablo. it's Michel. Yeah I mean I would say no change whatsoever in terms of our philosophy or approach here. You know first order priority is to continue to deploy capital in support of organic growth and you know you can see how you know we're doing so at attractive returns and paybacks and we see a lot of opportunity to continue to do so.

0:59:06

M &A is a strategic capability for us but we are very disciplined and M &A has to clear a high bar I would say when it comes to how we compare any transaction to other potential uses of capital including buying back our own shares. The two areas that we you know have talked about as potentially areas of interest are one asset management. We think that this is a space that's going to continue to consolidate. You know, we are also sort of attractive in terms of what we bring to the table when it comes to our capabilities, you know, especially if you think about, you know, the broader MetLife.

0:59:53

You know, we did a transaction last year that we're very pleased with, Pine Bridge. And, you know, the way we think about this is, you know, we don't need anything transformational, we'd be looking at, you know, the types of assets that can bring an adjacency, a capability, a solution or solutions that can help accelerate our growth trajectory. So that's one area. The other area that I've mentioned is group. And whereas we don't see any gaps in terms of, you know, we have the widest, deepest product offering, solutions offering in the industry, we're always in conversations with customers to see if there are things that we should consider that are important to them.

1:00:40

And outside of that, you would be opportunistic. But that's a little bit sort of the approach and the philosophy, which like I said, is unchanged. Thanks, Michelle.

1:00:53
Operator

There are no further questions at this time. I will now turn the call back to John Hall, treasurer and global head of investor relations for closing remarks.

1:01:06
John Hall (Investor Relations)

Thank you very much, operator, and thanks all for joining us on a very busy morning. Take care and enjoy the day. This concludes today's call.

1:01:18
Operator

Thank you for attending. You may now disconnect.