
MetLife (MET) · Insurance
MetLife Q2 2026 earnings: summary, key numbers & outlook
Results filed 5 Aug 2026 · Quarter ended 30 Jun 2026
Slides (22 pages)Press release ↗Investor relations ↗
Summaries and transcripts are machine-generated and can contain errors.
In brief
MetLife says its New Frontier strategy is delivering broad growth across every operating segment, with Asia sales up 17% in constant currency and Latin America led by third-party distribution in Brazil.
MetLife reported growth in every operating segment. Group Benefits sales are up 9% year-to-date, with solid growth in both National Accounts and Regional Business. In Retirement and Income Solutions, U.K. longevity reinsurance and structured settlements drove demand. Asia, Latin America and EMEA all posted sales gains, and MetLife Investment Management grew with the PineBridge Investments acquisition.
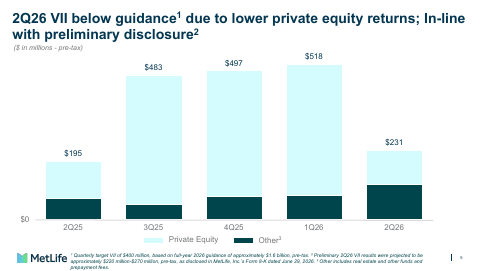
Management says New Frontier is the right strategy and it is moving with speed and purpose. It is investing in AI, product innovation and local-currency products, and describes its M&A as disciplined, focused on adjacencies or complementary capabilities rather than anything transformational. The tension is that earnings depend partly on market-sensitive items: variable investment income fell short of guidance because of weaker private equity returns, and Mexico's value-added tax change weighed on Latin America.
No call transcript for this quarter, so this summary also draws on: Webull (Benzinga transcript) ↗.
Slides & documents
Open the slide deck (PDF, 22 pages) ↗

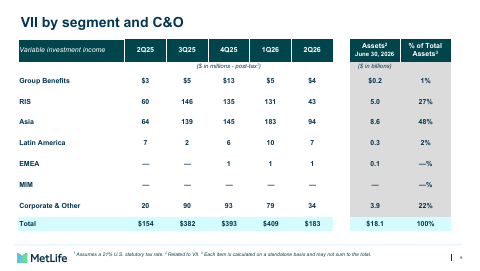
Showing the first 6 of 22 pages.
From MetLife investor relations
- Investor PresentationSlide deck ↗
- General Account AUM Fact SheetFinancial tables ↗
- Quarterly FilingDocument ↗
- Form 10-QDocument ↗
SEC filing
Key numbers
- Premiums, fees and other revenues · GAAP
- $13.7 billion
- Net income · GAAP
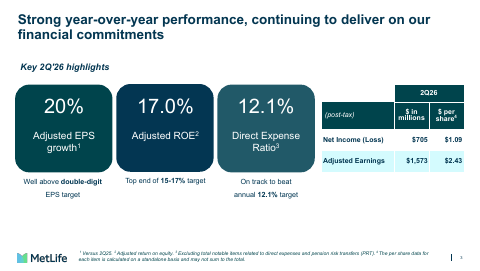
- $705 million
- Net income per diluted share · GAAP
- $1.09
- Adjusted earnings per share · non-GAAP
- $2.43
- Adjusted earnings · non-GAAP
- $1.6 billion
- Adjusted return on equity · non-GAAP
- 17%
up 7% from a year ago
up 1% from a year ago
up 6% from a year ago
up 20% from a year ago
up 15% from a year ago
17% for the second straight quarter
| Segment or metric | Value | Change |
|---|---|---|
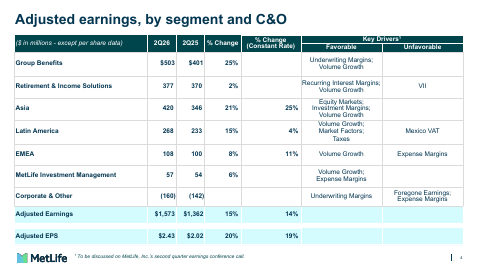
| Group Benefits adjusted earnings | $503 million | up 25% |
| Retirement and Income Solutions adjusted earnings | $377 million | up 2% |
| Asia adjusted earnings | $420 million | up 21% |
| Latin America adjusted earnings | $268 million | up 15% |
| EMEA adjusted earnings | $108 million | up 8% |
| MetLife Investment Management total assets under management | $748.1 billion | up 20% |
Where each number comes from
- Premiums, fees and other revenues: “Premiums, fees and other revenues (PFOs) increased 7% to $13.7 billion.”
- Net income: “Net income increased 1%1 to $705 million, or $1.09 per share.”
- Net income per diluted share: “On a per-share basis, net income increased 6 percent to $1.09.”
- Adjusted earnings per share: “Adjusted earnings increased 15% to $1.6 billion, driven by favorable underwriting and volume growth. •Adjusted earnings per share increased 20% to $2.43.”
- Adjusted earnings: “Adjusted earnings increased 15% to $1.6 billion, driven by favorable underwriting and volume growth.”
- Adjusted return on equity: “Adjusted return on equity of 17% for the second straight quarter, at the top of our range.”
- Group Benefits adjusted earnings: “Group Benefits adjusted earnings up 25% to $503 million.”
- Retirement and Income Solutions adjusted earnings: “Retirement and Income Solutions adjusted earnings up 2% to $377 million.”
- Asia adjusted earnings: “Asia adjusted earnings up 21% to $420 million.”
- Latin America adjusted earnings: “Latin America adjusted earnings up 15% to $268 million.”
- EMEA adjusted earnings: “EMEA adjusted earnings up 8% to $108 million.”
- MetLife Investment Management total assets under management: “Total assets under management were $748.1 billion, up 20 percent.”
Copied from the press release ↗ and other documents in the SEC filing ↗. A figure is published only if its sentence is in those documents.
| From the filing | Q2 2026 | vs year ago | vs last quarter |
|---|---|---|---|
| Revenue | $19.2B | +10.5% | +0.4% |
| Operating income | $1.6B | +15.1% | −1.7% |
| Net income | $736.0M | +1.0% | −37.9% |
| Diluted EPS | $1.09 | +5.8% | −37.4% |
| Operating margin | 8.4% | +0.4 pts | −0.2 pts |
Calculated by code from XBRL, not by the model.
Outlook
| Metric | Period | Outlook |
|---|---|---|
| Variable investment income, pre-tax | full-year 2026 | approximately $1.6 billion |
| Direct expense ratio target | 2026 | 12.1% |
Key takeaways
Growth reached every operating segment
Adjusted premiums, fees and other revenues excluding pension risk transfers grew 5% with growth across all segments. This points to demand across Group Benefits, retirement, international and asset management, not one engine.
Asia sales rose 17% on broad regional strength
Asia sales were $794 million, up 17% on a constant currency basis, driven by strong performance across the region. The release names volume growth as a driver of Asia's earnings.
Brazil third-party distribution powers Latin America sales
Latin America sales rose 9% on a constant currency basis, mainly from third-party distribution, particularly in Brazil through the Xcelerator platform. Management also described its Brazil business as the fastest-growing life insurer in that market.
Retirement demand came from U.K. longevity reinsurance
Retirement and Income Solutions premiums excluding pension risk transfers rose 19%, mainly on U.K. longevity reinsurance and structured settlement sales. Total retained liability exposure grew 3%.
PineBridge deal lifted MetLife Investment Management scale
MetLife Investment Management's total assets under management reached $748.1 billion, up 20%, and other revenues rose 34% largely on the PineBridge Investments acquisition. MIM acquired PineBridge on December 30, 2025.
Charts
Fourth quarter worked out from the annual figure.
Data
| Q4 2024 | $18.7B * |
| Q1 2025 | $18.6B |
| Q2 2025 | $17.3B |
| Q3 2025 | $17.4B |
| Q4 2025 | $23.8B * |
| Q1 2026 | $19.1B |
| Q2 2026 | $19.2B |
| Q3 2026 | $20.5B |
Data
| Q1 2025 | $1.28 |
| Q2 2025 | $1.03 |
| Q3 2025 | $1.22 |
| Q1 2026 | $1.74 |
| Q2 2026 | $1.09 |
| Q3 2026 | $3.67 |
Fourth-quarter EPS appears once the press release is read; filings report it only for the full year.
Data
| Q4 2024 | 8.0% |
| Q1 2025 | 7.6% |
| Q2 2025 | 8.0% |
| Q3 2025 | 9.5% |
| Q4 2025 | 7.1% |
| Q1 2026 | 8.6% |
| Q2 2026 | 8.4% |
| Q3 2026 | 8.9% |
Questions
What is MetLife's New Frontier strategy?
It is the strategy management credits for balanced growth and attractive returns this quarter, and says it is moving forward with speed and purpose. The release says it is delivering growth across all operating segments.
Where did MetLife's sales growth come from this quarter?
Asia sales rose 17% and EMEA sales rose 15% in constant currency, Latin America rose 9%, and Group Benefits sales are up 9% year-to-date. Latin America growth was led by third-party distribution in Brazil.
How did the PineBridge acquisition affect MetLife Investment Management?
MetLife Investment Management's other revenues rose 34%, primarily reflecting the PineBridge Investments acquisition and business growth. Total assets under management reached $748.1 billion, up 20%.
What is management's stance on acquisitions and AI?
Management says it is very disciplined on M&A and would look at adjacencies or complementary capabilities rather than anything transformational. It also says AI is becoming a structural advantage for MetLife.
What headwinds appeared in the quarter?
Variable investment income came in below guidance because of lower private equity returns, in line with the preliminary disclosure. In Latin America, the Mexico value-added tax change partly offset volume growth.