
KeyCorp (KEY) · Banking
KeyCorp Q3 2026 earnings: summary, key numbers & outlook
Results filed 20 Oct 2026 · Quarter ended 30 Sep 2026
Slides (20 pages)Press release ↗Investor relations ↗
Summaries and transcripts are machine-generated and can contain errors.
In brief
KeyCorp's commercial lending and capital markets franchise drove a record quarter, with deposits outpacing loans as the bank raised its loan growth outlook and kept steering toward 15%+ returns by 2027.
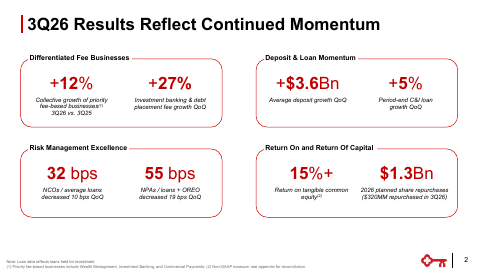
Key's Commercial Bank was the engine this quarter. Period-end commercial and industrial loans grew 5% from the prior quarter, and clients drew more on credit lines, which the bank links to businesses investing in themselves. Investment banking and debt placement fees rose 27% sequentially on M&A and syndications. Average deposits grew $3.6 billion, and consumer loans kept running off by design.
Management is steering toward a return on tangible common equity of 15%+ by the end of 2027, helped by repricing of low-yielding fixed-rate assets and continued share repurchases. It raised its loan growth outlook and lowered its charge-off outlook. The tension: expenses keep rising on bankers and technology, and a sharp economic turn would test both credit quality and fee momentum.
Slides & documents
Open the slide deck (PDF, 20 pages) ↗


Showing the first 6 of 20 pages.
From KeyCorp investor relations
SEC filing
Key numbers
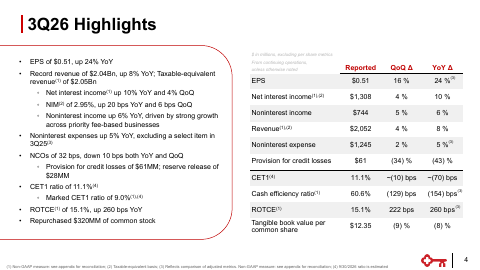
- Total revenue · GAAP
- $2.04 billion
- Net income from continuing operations attributable to Key common shareholders · GAAP
- $537 million
- Diluted EPS · GAAP
- $0.51
- Net interest margin (TE)
- 2.95%
up 8% year-over-year and 4% sequentially
up from $454 million a year ago
up 24% year-over-year
up 20 basis points year-over-year and 6 basis points sequentially
| Segment or metric | Value | Change |
|---|---|---|
| Commercial Bank revenue (TE) | $1.2B | up 7.7% from 3Q25 |
| Consumer Bank revenue (TE) | $1.0B | up 5.9% from 3Q25 |
| Investment banking and debt placement fees | $214.0M | up 26.6% from 2Q26 |
| Assets under management | $74.5B | up 9.7% from 3Q25 |
Where each number comes from
- Total revenue: “Record revenue of $2.04 billion, up 8% year-over-year and 4% sequentially”
- Net income from continuing operations attributable to Key common shareholders: “net income from continuing operations attributable to Key common shareholders of $537 million, or $0.51 per diluted common share”
- Diluted EPS: “net income from continuing operations attributable to Key common shareholders of $537 million, or $0.51 per diluted common share”
- Net interest margin (TE): “Net interest margin of 2.95%, up 20 basis points year-over-year and 6 basis points sequentially”
- Commercial Bank revenue (TE): “Commercial Bank | 1,201 | 1,108 | 1,115 | 8.4 | 7.7”
- Consumer Bank revenue (TE): “Consumer Bank | $1,049 | $1,010 | $991 | 3.9% | 5.9%”
- Investment banking and debt placement fees: “Investment banking and debt placement fees | $214 | $169 | $184 | 26.6% | 16.3%”
- Assets under management: “Assets under management at period end | $74,453 | $74,204 | $67,855 | 0.3% | 9.7%”
Copied from the press release ↗ and other documents in the SEC filing ↗. A figure is published only if its sentence is in those documents.
| From the filing | Q3 2026 | vs year ago | vs last quarter |
|---|---|---|---|
| Revenue | $2.1B | +8.3% | +4.5% |
| Net income | $579.0M | +18.4% | +13.8% |
| Diluted EPS | $0.51 | +24.4% | +15.9% |
| Free cash flow | $684.0M | +86.4% | +193.6% |
Calculated by code from XBRL, not by the model.
Outlook
| Metric | Period | Outlook |
|---|---|---|
| Net interest margin exit rate | fourth quarter of 2026 | ~3.00% |
| Revenue growth | FY2026 vs FY2025 | up ~8% |
| Average loans growth | FY2026 vs FY2025 | up ~5% |
| Net charge-offs to average loans | FY2026 | 37 – 39 bps |
| GAAP tax rate | FY2026 | ~22% |
Key takeaways
Commercial lending is Key's growth engine
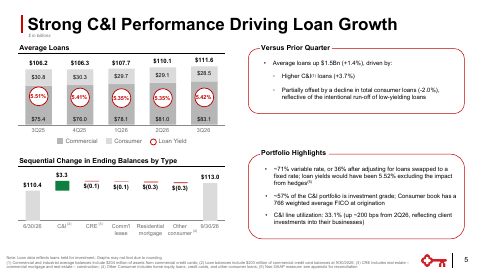
Period-end C&I loans grew 5% sequentially and Commercial Bank average loans rose 11.7% year-over-year. Management raised full-year average commercial loan growth to about 10%, from 8–10%.
Clients are drawing more on credit lines
C&I line utilization was 33.1%, up about 200 bps from the prior quarter, which Key attributes to clients investing in their businesses. About 57% of the C&I portfolio is investment grade.
Capital markets fees rebounded on M&A
Investment banking and debt placement fees rose 27% sequentially, driven by higher M&A fees and syndications. Priority fee-based businesses (Wealth Management, Investment Banking, Commercial Payments) grew 12% collectively year-over-year.
Deposit growth is anchored in operating relationships
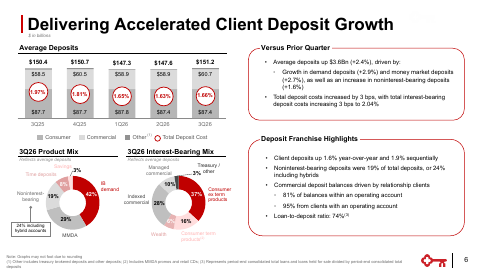
Average deposits rose $3.6 billion sequentially, and 81% of commercial balances sit within an operating account. Consumer loans continued intentional run-off of low-yielding balances.
Credit outlook improved and buybacks continue
Net charge-offs fell to 0.32% and nonperforming assets declined 19 bps sequentially, so Key cut its full-year charge-off outlook to 37–39 bps. It repurchased $320 million of stock and plans $1.3 billion in 2026.
Charts
Fourth quarter worked out from the annual figure.
Data
| Q4 2024 | $865.0M * |
| Q1 2025 | $1.8B |
| Q2 2025 | $1.8B |
| Q3 2025 | $1.9B |
| Q4 2025 | $2.0B * |
| Q1 2026 | $2.0B |
| Q2 2026 | $2.0B |
| Q3 2026 | $2.1B |
Data
| Q1 2025 | $0.33 |
| Q2 2025 | $0.35 |
| Q3 2025 | $0.41 |
| Q1 2026 | $0.44 |
| Q2 2026 | $0.44 |
| Q3 2026 | $0.51 |
Fourth-quarter EPS appears once the press release is read; filings report it only for the full year.
Data
| Q4 2024 | $1.7B |
| Q1 2025 | -$150.0M |
| Q2 2025 | $1.2B |
| Q3 2025 | $367.0M |
| Q4 2025 | $673.0M |
| Q1 2026 | -$74.0M |
| Q2 2026 | $233.0M |
| Q3 2026 | $684.0M |
Operating cash flow minus capital expenditure, from cash flow statements.
Questions
What drove KeyCorp's growth in Q3 2026?
Commercial and industrial lending and investment banking. Period-end C&I loans rose 5% sequentially and investment banking and debt placement fees rose 27%, driven by M&A and syndications.
How is KeyCorp's deposit franchise performing?
Average deposits rose $3.6 billion sequentially, led by demand and money market deposits. Client deposits were up 1.9% sequentially, and 81% of commercial balances sit within an operating account.
What is management targeting next?
A return on tangible common equity of 15%+ by the end of 2027, plus a net interest margin of 3.25%+. The Q3 result already exceeded 15%.
Did KeyCorp change its outlook?
Yes. It raised average loan growth to about 5% and commercial loan growth to about 10%, and lowered its net charge-off outlook to 37–39 bps from 40–45 bps.
What is the main risk to the plan?
Expenses keep rising, with personnel costs up 10% year-over-year on front-line bankers and technology investment. The plan also depends on a constructive economy for credit quality and fee income.
Call recording
Call recording on YouTube ↗. Official replay ↗.