
KeyCorp (KEY) · Banking
KeyCorp Q2 2026 earnings: summary, key numbers & outlook
Results filed 21 Jul 2026 · Quarter ended 30 Jun 2026
Slides (19 pages)Press release ↗Investor relations ↗
Summaries and transcripts are machine-generated and can contain errors.
In brief
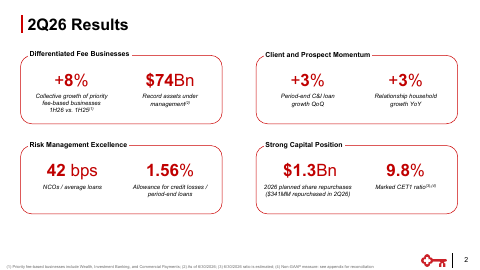
KeyCorp is leaning into commercial lending and its priority fee businesses, with record assets under management of $74 billion and a raised 2026 outlook for loan growth.
Commercial and industrial lending drove the quarter. Period-end C&I loans rose 3% from the prior quarter, while consumer loans kept shrinking as Key deliberately runs off low-yielding balances. Its priority fee businesses (wealth, investment banking and commercial payments) grew a collective 8% in the first half. Assets under management hit a record, relationship households grew 3% year over year, and commercial payments posted double-digit fee growth.
Management raised its 2026 loan growth outlook and still targets a return on tangible common equity above 15% by year-end 2027. It plans at least $1.3 billion of share repurchases in 2026, backed by a new $3 billion authorization. The main tension is credit and fees. Nonperforming loans rose and investment banking and commercial mortgage servicing fees fell sequentially, while the plan depends on steady commercial growth and front-line banker hiring.
Slides & documents
Open the slide deck (PDF, 19 pages) ↗

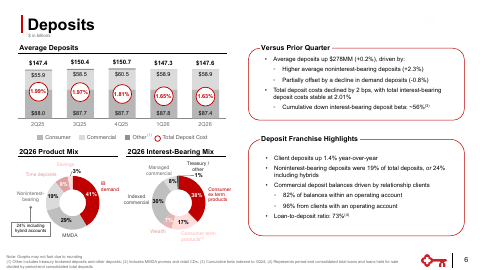
Showing the first 6 of 19 pages.
From KeyCorp investor relations
SEC filing
Key numbers
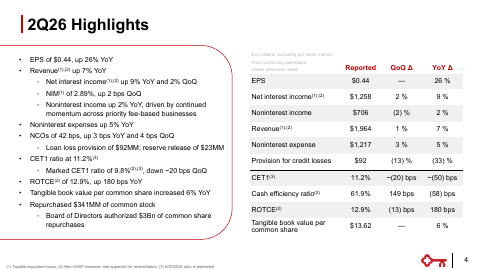
- Total revenue (TE) · non-GAAP
- $2.0B
- Net income from continuing operations attributable to Key common shareholders · GAAP
- $472 million
- Diluted EPS from continuing operations · GAAP
- $0.44
- Net interest margin (TE) · non-GAAP
- 2.89%
- Return on average tangible common equity · non-GAAP
- 12.89%
up 6.7% from 2Q25
up 22.0% from a year ago
up from $0.35 a year ago
up 2 bps sequentially
up 180 bps from a year ago
| Segment or metric | Value | Change |
|---|---|---|
| Consumer Bank revenue (TE) | $1.0B | up 4.6% from 2Q25 |
| Commercial Bank revenue (TE) | $1.1B | up 3.2% from 2Q25 |
| Assets under management | $74.2B | up 15.5% from 2Q25 |
| Commercial Bank average loans and leases | $76.2B | up 10.3% from 2Q25 |
Where each number comes from
- Total revenue (TE): “Total revenue (TE) | $1,964 | $1,953 | $1,840 | 0.6% | 6.7%”
- Net income from continuing operations attributable to Key common shareholders: “announced net income from continuing operations attributable to Key common shareholders of $472 million, or $0.44 per diluted common share, for the second quarter of 2026”
- Diluted EPS from continuing operations: “announced net income from continuing operations attributable to Key common shareholders of $472 million, or $0.44 per diluted common share, for the second quarter of 2026”
- Net interest margin (TE): “net interest margin of 2.89% increased 2 bps sequentially”
- Return on average tangible common equity: “Return on average tangible common equity from continuing operations (a) | 12.89% | 13.02% | 11.09% | (13) bps | 180 bps”
- Consumer Bank revenue (TE): “Consumer Bank | $1,010 | $977 | $966 | 3.4% | 4.6%”
- Commercial Bank revenue (TE): “Commercial Bank | 1,108 | 1,119 | 1,074 | (1.0) | 3.2”
- Assets under management: “Assets under management at period end | $74,204 | $69,756 | $64,244 | 6.4% | 15.5%”
- Commercial Bank average loans and leases: “Average balances Loans and leases | $76,238 | $73,146 | $69,089 | 4.2% | 10.3%”
Copied from the press release ↗ and other documents in the SEC filing ↗. A figure is published only if its sentence is in those documents.
| From the filing | Q2 2026 | vs year ago | vs last quarter |
|---|---|---|---|
| Revenue | $2.0B | +6.7% | +0.6% |
| Net income | $509.0M | +19.8% | −2.5% |
| Diluted EPS | $0.44 | +25.7% | +0.0% |
| Free cash flow | $233.0M | −80.8% | — |
Calculated by code from XBRL, not by the model.
Outlook
| Metric | Period | Outlook |
|---|---|---|
| Revenue growth | FY2026 vs. FY2025 | up 7 – 8% |
| Net interest income growth | FY2026 vs. FY2025 | up 9 – 11% |
| Average loans growth | FY2026 vs. FY2025 | up 4 – 5% |
| Average commercial loans growth | FY2026 vs. FY2025 | up 8 – 10% |
| Net charge-offs to average loans | FY2026 | 40 – 45 bps |
| GAAP tax rate | FY2026 | ~22% |
Key takeaways
Commercial lending is driving growth
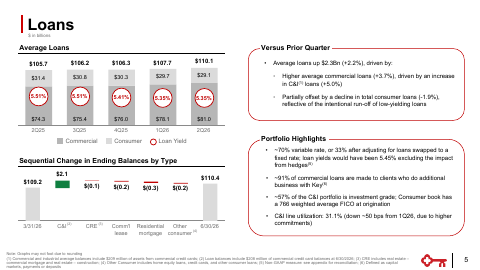
Period-end C&I loans rose $2.1 billion, or 3%, sequentially, and about 91% of commercial loans go to clients who also use Key for capital markets, payments or deposits. Management raised its average commercial loan growth outlook to 8–10% from 6–8%.
Priority fee businesses are the growth story
Wealth, investment banking and commercial payments grew a collective 8% in the first half, and assets under management reached a record $74 billion. Commercial payments delivered double-digit fee growth year over year.
Consumer book is deliberately shrinking
Average consumer loans fell 7.4% year over year as Key intentionally runs off low-yielding loans. This mix shift toward higher-yielding commercial loans helps margin, but it shrinks the consumer lending base.
Capital return stays a pillar
Key repurchased $341 million of shares in the quarter, plans at least $1.3 billion in 2026, and its board authorized $3 billion of repurchases. Marked CET1 fell about 20 bps sequentially to 9.8%, so buybacks are drawing on capital as risk-weighted assets grow.
Credit and fee softness are the watch items
Nonperforming loans rose to $809 million from $682 million last quarter, led by C&I and commercial mortgage. Investment banking fees fell 14% sequentially and commercial mortgage servicing fees fell 21%, though investment banking pipelines grew 9% sequentially.
Charts
Fourth quarter worked out from the annual figure.
Data
| Q4 2024 | $865.0M * |
| Q1 2025 | $1.8B |
| Q2 2025 | $1.8B |
| Q3 2025 | $1.9B |
| Q4 2025 | $2.0B * |
| Q1 2026 | $2.0B |
| Q2 2026 | $2.0B |
| Q3 2026 | $2.1B |
Data
| Q1 2025 | $0.33 |
| Q2 2025 | $0.35 |
| Q3 2025 | $0.41 |
| Q1 2026 | $0.44 |
| Q2 2026 | $0.44 |
| Q3 2026 | $0.51 |
Fourth-quarter EPS appears once the press release is read; filings report it only for the full year.
Data
| Q4 2024 | $1.7B |
| Q1 2025 | -$150.0M |
| Q2 2025 | $1.2B |
| Q3 2025 | $367.0M |
| Q4 2025 | $673.0M |
| Q1 2026 | -$74.0M |
| Q2 2026 | $233.0M |
| Q3 2026 | $684.0M |
Operating cash flow minus capital expenditure, from cash flow statements.
Questions
What is driving KeyCorp's growth this quarter?
Commercial and industrial lending, with period-end C&I loans up 3% sequentially, plus its priority fee businesses of wealth, investment banking and commercial payments, which grew a collective 8% in the first half.
How is KeyCorp's wealth business performing?
Assets under management reached a record $74 billion, up 15.5% from a year ago, and trust and investment services income rose 8.9% year over year.
Did KeyCorp change its 2026 outlook?
Yes. It raised revenue growth to 7–8% from about 7%, and raised average loan growth to 4–5% and average commercial loan growth to 8–10%.
What is KeyCorp's strategy for capital return?
It repurchased $341 million of shares in the quarter, expects at least $1.3 billion of repurchases in 2026, and its board authorized $3 billion of repurchases.
What are the main risks KeyCorp is watching?
Credit quality, with nonperforming loans up to 0.73% of loans from 0.62% last quarter, and weaker investment banking and commercial mortgage servicing fees sequentially.