
IQVIA (IQV) · Life Sciences
IQVIA Q2 2026 earnings: summary, key numbers & outlook
Results filed 28 Jul 2026 · Quarter ended 30 Jun 2026
Slides (15 pages)Press release ↗Investor relations ↗
Summaries and transcripts are machine-generated and can contain errors.
In brief
IQVIA reported record R&D Solutions net new bookings of over $3.1 billion and rising adoption of its AI solutions, and said forward indicators point to sustained momentum into 2027.
IQVIA's R&D Solutions unit, which runs clinical trials for drug developers, signed record net new bookings of over $3.1 billion, lifting contracted backlog to $34.2 billion. In Commercial Solutions, patient solutions and commercial engagement services grew at double-digit rates, and analytics and consulting grew at a high-single-digit organic rate. Management also pointed to increased adoption of its AI solutions. Since January 1, 2026, results have been reported under a simplified two-segment structure.
Management says forward-looking indicators across both segments point to sustained momentum for the rest of 2026 and into 2027, and it raised its full-year outlook. About $9.2 billion of backlog is expected to convert to revenue over the next twelve months. The main tension is execution: the plan relies on turning record bookings into revenue and on the new organizational model delivering its expected benefits, with acquisitions contributing more to growth than previously assumed.
No call transcript for this quarter, so this summary also draws on: Quartr ↗, BriefGlance ↗.
Slides & documents
Open the slide deck (PDF, 15 pages) ↗

Showing the first 6 of 15 pages.
From IQVIA investor relations
SEC filing
Key numbers
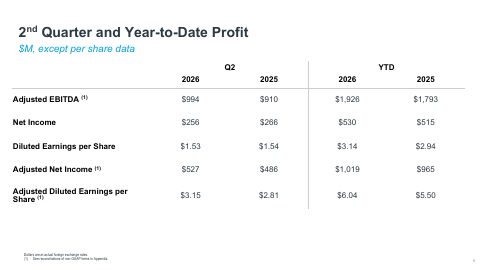
- Revenue · GAAP
- $4,368 million
- Net income · GAAP
- $256 million
- Diluted EPS · GAAP
- $1.53
- Adjusted diluted EPS · non-GAAP
- $3.15
- Adjusted EBITDA · non-GAAP
- $994 million
- Operating cash flow · GAAP
- $558 million
- Free cash flow · non-GAAP
- $360 million
up 8.7% year-over-year
up 12.1% year-over-year
up 9.2% year-over-year
up 26.0% year-over-year
up 23.3% year-over-year
| Segment or metric | Value | Change |
|---|---|---|
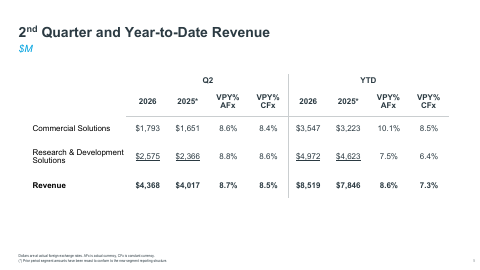
| Commercial Solutions revenue | $1,793 million | up 8.6% year-over-year |
| R&D Solutions revenue | $2,575 million | up 8.8% year-over-year |
| R&DS net new bookings | $3.15 billion | up 19% year-over-year |
| R&DS contracted backlog | $34.2 billion | |
| Last-twelve-months net new bookings | $11.3 billion | up 13% year-over-year |
Where each number comes from
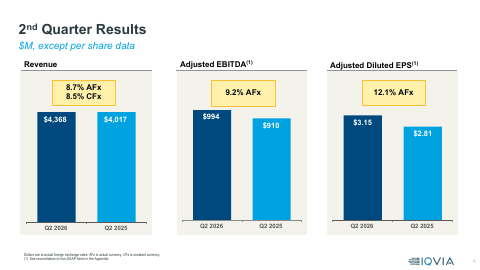
- Revenue: “Revenue for the second quarter of $4,368 million increased 8.7% on a reported basis and 8.5% at constant currency, compared to the second quarter of 2025.”
- Net income: “Second-quarter GAAP Net Income was $256 million and GAAP Diluted Earnings per Share was $1.53.”
- Diluted EPS: “Second-quarter GAAP Net Income was $256 million and GAAP Diluted Earnings per Share was $1.53.”
- Adjusted diluted EPS: “Adjusted Net Income was $527 million and Adjusted Diluted Earnings per Share was $3.15, up 12.1% year-over-year.”
- Adjusted EBITDA: “Adjusted EBITDA was $994 million, up 9.2% year-over-year.”
- Operating cash flow: “For the second quarter, Operating Cash Flow was $558 million, up 26.0% year-over-year, and Free Cash Flow was $360 million, up 23.3% year-over-year.”
- Free cash flow: “For the second quarter, Operating Cash Flow was $558 million, up 26.0% year-over-year, and Free Cash Flow was $360 million, up 23.3% year-over-year.”
- Commercial Solutions revenue: “Commercial Solutions revenue of $1,793 million increased 8.6% on a reported basis and 8.4% at constant currency.”
- R&D Solutions revenue: “Research & Development Solutions revenue of $2,575 million grew 8.8% on a reported basis and 8.6% at constant currency.”
- R&DS net new bookings: “Second quarter net new bookings were $3.15 billion, an increase of 19% year-over-year, resulting in a book-to-bill ratio of 1.22x.”
- R&DS contracted backlog: “As of June 30, 2026, R&DS contracted backlog was $34.2 billion.”
- Last-twelve-months net new bookings: “The last-twelve months net new bookings were $11.3 billion, up 13% year-over-year.”
Copied from the press release ↗ and other documents in the SEC filing ↗. A figure is published only if its sentence is in those documents.
| From the filing | Q2 2026 | vs year ago | vs last quarter |
|---|---|---|---|
| Revenue | $4.4B | +8.7% | +5.2% |
| Operating income | $506.0M | +0.0% | −1.6% |
| Net income | $256.0M | −3.8% | −6.6% |
| Diluted EPS | $1.53 | −0.6% | −5.0% |
| Free cash flow | $360.0M | +23.3% | −26.7% |
| Operating margin | 11.6% | −1.0 pts | −0.8 pts |
Calculated by code from XBRL, not by the model.
Outlook
| Metric | Period | Outlook |
|---|---|---|
| Q3 revenue | third quarter of 2026 | $4,315 – $4,390 |
| Q3 Adjusted EBITDA | third quarter of 2026 | $1,000 – $1,020 |
| Q3 Adjusted diluted EPS | third quarter of 2026 | $3.19 – $3.29 |
| Full-year revenue | full-year 2026 | $17,275 million and $17,475 million |
| Full-year Adjusted EBITDA | full-year 2026 | $4,000 million and $4,050 million |
| Full-year Adjusted diluted EPS | full-year 2026 | $12.80 and $13.00 |
Key takeaways
R&D Solutions bookings hit a record level
Net new bookings were $3.15 billion, a 1.22x book-to-bill ratio, and the release calls them record-level. Strong bookings give IQVIA's clinical research business demand visibility ahead.
Backlog of $34.2 billion supports future R&D revenue
About $9.2 billion of contracted backlog is expected to convert to revenue in the next twelve months, representing growth of 7.5% year-over-year. This shows how much near-term work is already contracted.
AI solutions adoption is helping Commercial Solutions accelerate
Management cited increased adoption of its AI solutions as a contributor to stronger organic growth in Commercial Solutions. It positions IQVIA's AI offerings as a driver of demand, not only a branding theme.
Patient solutions and engagement services grow double digits
Within Commercial Solutions, patient solutions and commercial engagement services both grew at double-digit rates, while analytics and consulting grew at a high-single-digit organic rate. Growth is broad across the segment's service lines.
Acquisitions now contribute more to growth
The updated guidance assumes approximately 200 basis points of contribution from acquisitions versus 150 basis points previously. Management is leaning more on M&A alongside higher organic growth, and has raised its outlook for the year.
Charts
Fourth quarter worked out from the annual figure.
Data
| Q4 2024 | $4.0B * |
| Q1 2025 | $3.8B |
| Q2 2025 | $4.0B |
| Q3 2025 | $4.1B |
| Q4 2025 | $4.4B * |
| Q1 2026 | $4.2B |
| Q2 2026 | $4.4B |
| Q3 2026 | $4.4B |
Data
| Q1 2025 | $1.40 |
| Q2 2025 | $1.54 |
| Q3 2025 | $1.93 |
| Q1 2026 | $1.61 |
| Q2 2026 | $1.53 |
| Q3 2026 | $2.10 |
Fourth-quarter EPS appears once the press release is read; filings report it only for the full year.
Data
| Q4 2024 | 15.8% |
| Q1 2025 | 13.0% |
| Q2 2025 | 12.6% |
| Q3 2025 | 13.5% |
| Q4 2025 | 14.4% |
| Q1 2026 | 12.4% |
| Q2 2026 | 11.6% |
| Q3 2026 | 12.9% |
Data
| Q4 2024 | $721.0M |
| Q1 2025 | $426.0M |
| Q2 2025 | $292.0M |
| Q3 2025 | $772.0M |
| Q4 2025 | $561.0M |
| Q1 2026 | $491.0M |
| Q2 2026 | $360.0M |
| Q3 2026 | $667.0M |
Operating cash flow minus capital expenditure, from cash flow statements.
Questions
What was the biggest business development at IQVIA this quarter?
R&D Solutions posted record-level net new bookings of over $3.1 billion, a 1.22x book-to-bill ratio. Management said favorable forward-looking indicators across both segments point to sustained momentum for the rest of the year and into 2027.
How is AI affecting IQVIA's business?
Management said increased adoption of its AI solutions contributed to a strong acceleration of organic revenue growth in Commercial Solutions. The sources give no further detail on specific AI products or usage.
Which Commercial Solutions lines are growing fastest?
Patient solutions and commercial engagement services grew at double-digit rates. Analytics and consulting grew at a high-single-digit organic rate.
How much future clinical research revenue is already contracted?
R&DS contracted backlog was $34.2 billion as of June 30, 2026. IQVIA expects approximately $9.2 billion of it to convert to revenue in the next twelve months, representing growth of 7.5% year-over-year.
Did IQVIA change its outlook or how it is organized?
Yes. It raised its full-year 2026 guidance, citing stronger organic growth and a larger acquisition contribution, partly offset by a less favorable foreign exchange impact. Since January 1, 2026, it has reported two segments, Commercial Solutions and R&D Solutions, under a simplified organizational model.