Fifth Third (FITB) · Banking
Fifth Third Q2 2026 earnings: summary, key numbers & outlook
Results filed 17 Jul 2026 · Quarter ended 30 Jun 2026
Slides (45 pages)Press release ↗Investor relations ↗
Summaries and transcripts are machine-generated and can contain errors.
In brief
Fifth Third passed $300 billion in assets and became a Category III bank while integrating Comerica, with its Labor Day systems conversion on track to unlock the full $850 million cost-synergy run-rate.
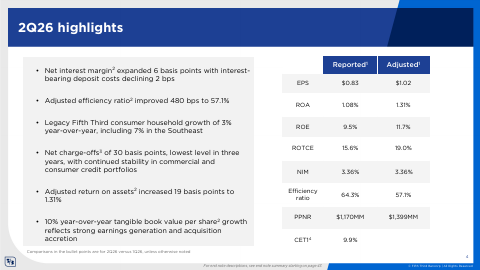
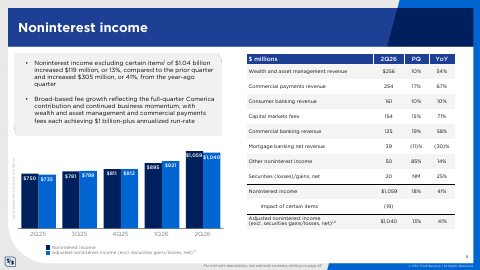
Fifth Third's second quarter was the first with a full quarter of Comerica. Fee businesses grew broadly: wealth and asset management and commercial payments each reached a $1 billion-plus annualized run-rate. Commercial lending was broad-based across legacy geographies and specialty verticals. Comerica Southwest deposit campaigns brought in $2.5 billion of consumer deposits, above internal targets. Legacy consumer households grew 3%, including 7% in the Southeast.
Management is steering toward the Labor Day weekend systems conversion, the final step to the full cost synergies, and toward revenue synergies across the expanded footprint. It continues to shift toward granular consumer deposits and away from higher-cost, non-relationship commercial deposits. The main risks are executing the conversion, supporting a larger Category III institution, and growing deposits in a competitive environment. Solar loan credit losses are also rising.
Slides & documents
Open the slide deck (PDF, 45 pages) ↗
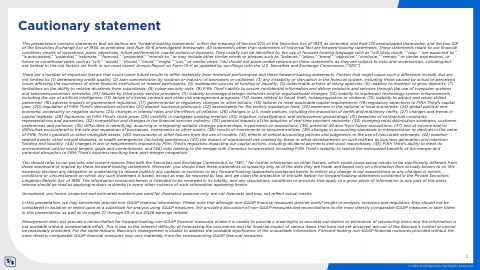
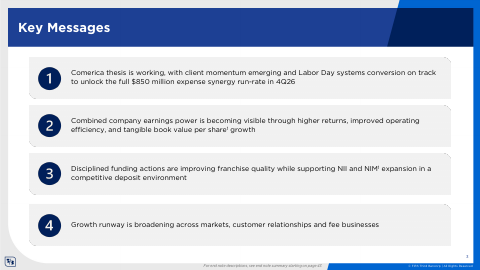
Showing the first 6 of 45 pages.
From Fifth Third investor relations
- Fact SheetFinancial tables ↗
- 10-QDocument ↗
- Market Risk DisclosuresDocument ↗
- FR Y-9CDocument ↗
- Basel III Pillar 3 DisclosuresDocument ↗
- Disclosure of Issue Price of Certain Debt InstrumentsDocument ↗
SEC filing
Key numbers
- Diluted EPS · GAAP
- $0.83
- Adjusted EPS · non-GAAP
- $1.02
- Net income available to common shareholders · GAAP
- $763 million
- Efficiency ratio (adjusted) · non-GAAP
- 57.1%
down from $0.88 a year ago
up from $591 million a year ago
improved 480 bps sequentially
| Segment or metric | Value | Change |
|---|---|---|
| Wealth and asset management revenue | $256.0M | up 54% year over year |
| Commercial payments revenue | $254.0M | up 67% year over year |
| Capital markets fees | $154.0M | up 71% year over year |
| Assets under management | 128.0B | up 75% year over year |
Where each number comes from
- Diluted EPS: “reported second quarter 2026 net income available to common shareholders of $763 million, or $0.83 per diluted share, compared to $128 million, or $0.15 per diluted share, in the prior quarter”
- Adjusted EPS: “Reported EPS of $0.83; adjusted EPS(a) of $1.02 excludes $0.19 of certain items on page 2”
- Net income available to common shareholders: “reported second quarter 2026 net income available to common shareholders of $763 million, or $0.83 per diluted share, compared to $128 million”
- Efficiency ratio (adjusted): “Disciplined expense management; adjusted efficiency ratio(a) of 57.1% improved 480 bps sequentially”
- Wealth and asset management revenue: “Wealth and asset management revenue | $256 | $233 | $166 | 10% | 54%”
- Commercial payments revenue: “Commercial payments revenue | 254 | 218 | 152 | 17% | 67%”
- Capital markets fees: “Capital markets fees | 154 | 134 | 90 | 15% | 71%”
- Assets under management: “Assets under management ($ in billions)(g) | 128 | 119 | 73 | 8% | 75%”
Copied from the press release ↗ and other documents in the SEC filing ↗. A figure is published only if its sentence is in those documents.
| From the filing | Q2 2026 | vs year ago | vs last quarter |
|---|---|---|---|
| Net income | $801.0M | +27.5% | +385.5% |
| Diluted EPS | $0.83 | −5.7% | +453.3% |
| Free cash flow | $2.6B | +125.5% | — |
Calculated by code from XBRL, not by the model.
Outlook
| Metric | Period | Outlook |
|---|---|---|
| Average loans and leases (including HFS) | full year 2026 | $174 - 176 billion |
| Net interest income | full year 2026 | $8.74 - $8.80 billion |
| Noninterest income | full year 2026 | $4.06 - $4.16 billion |
| Noninterest expense | full year 2026 | $7.22 - $7.26 billion |
| Net charge-off ratio | full year 2026 | 30 - 40 bps |
| Effective tax rate | full year 2026 | 22 - 23% |
| Net interest income growth | 3Q26 | up 2 - 2.5% |
| Noninterest income growth | 3Q26 | up 1 - 3% |
| Noninterest expense change | 3Q26 | down 1 - 2% |
| Net charge-off ratio | 3Q26 | 30 - 35 bps |
| Effective tax rate | 3Q26 | 22.5% |
Key takeaways
Comerica systems conversion set for Labor Day
The conversion is the final integration step and unlocks the full $850 million annualized expense-synergy run-rate in 4Q26. Execution on that weekend is the key near-term integration milestone.
Southwest deposit campaign beat internal targets
Comerica Southwest marketing delivered $2.5 billion of consumer deposits, above internal targets. It is early evidence of revenue synergies in the expanded footprint.
Fee businesses broadening beyond lending
Wealth and asset management and commercial payments each reached a $1 billion-plus annualized run-rate, and Newline deposits rose $2.1 billion. Fees were about 33% of pro-forma revenue, diversifying away from interest-rate cycles.
Deposit mix shifting toward consumers
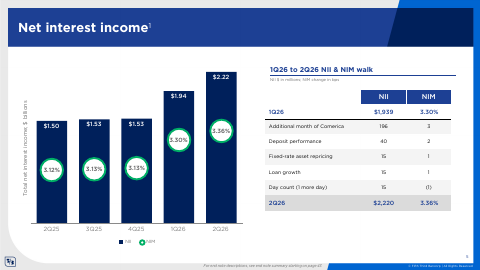
Consumer deposits grew $4.6 billion while higher-cost, non-relationship commercial deposits were intentionally reduced. Interest-bearing deposit costs fell 2 bps to 2.13%.
Fifth Third crosses into Category III status
Total assets passed $300 billion, triggering Category III treatment after years of preparing in risk, capital, liquidity and reporting. Management says it can meet all requirements on or before required dates.
Charts
Data
| Q1 2025 | $0.71 |
| Q2 2025 | $0.88 |
| Q3 2025 | $0.91 |
| Q1 2026 | $0.15 |
| Q2 2026 | $0.83 |
| Q3 2026 | $0.90 |
Fourth-quarter EPS appears once the press release is read; filings report it only for the full year.
Data
| Q4 2024 | -$246.0M |
| Q1 2025 | $1.1B |
| Q2 2025 | $1.2B |
| Q3 2025 | $886.0M |
| Q4 2025 | $765.0M |
| Q1 2026 | -$1.3B |
| Q2 2026 | $2.6B |
| Q3 2026 | $651.0M |
Operating cash flow minus capital expenditure, from cash flow statements.
Questions
What is the next milestone in Fifth Third's Comerica integration?
The systems conversion is scheduled for Labor Day weekend and is the final step to unlock the full $850 million expense-synergy run-rate in 4Q26.
Is there evidence of revenue synergies from Comerica?
Yes. Deposit campaigns in the Comerica Southwest markets brought in $2.5 billion of consumer deposits, above internal targets, and commercial loan growth was broad-based across legacy geographies and specialty verticals.
Which fee businesses are growing fastest?
Capital markets fees rose 71%, commercial payments 67% and wealth and asset management 54% year over year. Wealth and asset management and commercial payments each reached a $1 billion-plus annualized run-rate.
How is Fifth Third changing its deposit base?
It is re-mixing toward granular consumer deposits, which grew $4.6 billion, while intentionally reducing higher-cost, non-relationship commercial deposits. Interest-bearing deposit costs fell 2 bps to 2.13%.
What regulatory change did Fifth Third reach this quarter?
Total assets surpassed $300 billion and the bank formally became a Category III institution. Management says it is prepared to meet all requirements on or before required dates.