
Cognizant (CTSH) · IT Services
Cognizant Q3 2026 earnings: summary, key numbers & outlook
Results filed 29 Oct 2026 · Quarter ended 30 Sep 2026
Slides (20 pages)Official transcript (PDF) ↗Press release ↗Investor relations ↗
Summaries and transcripts are machine-generated and can contain errors.
In brief
Cognizant launched AI Nexus and a Gemini Frontier Capability Group of 18,000 associates, positioning itself as an "AI builder" while Financial Services and acquisitions drove growth.
Cognizant pushed deeper into AI-led services this quarter. It launched AI Nexus, an operating layer for metering and governing AI spend, and Cognizant Activate, a unit for emerging enterprises. It made agentic AI tools generally available for TriZetto health-plan platforms and signed client deals with Gilead, EBRD, Ingenico and SITA. Financial Services and Communications, Media & Technology grew double digits, while Health Sciences and Products and Resources shrank.
Management is steering toward an AI Builder model, with outcome-based pricing, AI-infused rate cards and platform monetization, backed by skilling, acquisitions such as DyFlex, and partners including Google Cloud, Anthropic, OpenAI and CrowdStrike. The tension is demand: management says macro uncertainty has hit healthcare and consumer-facing sectors harder than assumed and is weighing on discretionary spending in Q4. Quarterly bookings fell 7%, and the Project Leap restructuring is costing more than first estimated.
No call transcript for this quarter, so this summary also draws on: Webull ↗, CRN Asia ↗.
Slides & documents
Open the slide deck (PDF, 20 pages) ↗

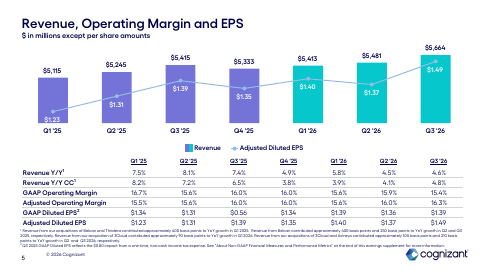
Showing the first 6 of 20 pages.
From Cognizant investor relations
- TranscriptCompany's official transcript ↗
- WebcastWebcast replay ↗
- InfographicDocument ↗
- Form 10-QDocument ↗
SEC filing
Key numbers
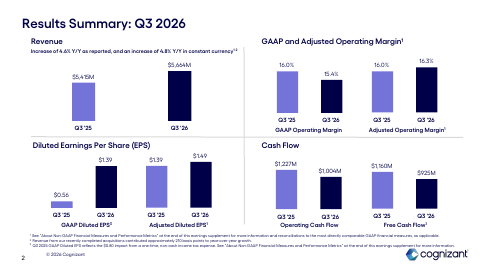
- Revenue · GAAP
- $5.7 billion
- Net income · GAAP
- $627.0M
- GAAP diluted EPS · GAAP
- $1.39
- Adjusted diluted EPS · non-GAAP
- $1.49
- Income from operations · GAAP
- $872.0M
- GAAP operating margin · GAAP
- 15.4%
- Adjusted operating margin · non-GAAP
- 16.3%
- Operating cash flow · GAAP
- $1.0B
up 4.6% year-over-year, or 4.8% in constant currency
up from $274 a year ago
up 148% year-over-year
up 7.2% year-over-year
up from $866 a year ago
down 60 basis points year-over-year
up 30 basis points year-over-year
down from $1,227 a year ago
| Segment or metric | Value | Change |
|---|---|---|
| Financial Services | $1.8B | up 12.0% year-over-year, 12.3% in constant currency |
| Health Sciences | $1.6B | down 1.1% year-over-year, 0.9% in constant currency |
| Products and Resources | $1.4B | down 0.9% year-over-year, 0.8% in constant currency |
| Communications, Media and Technology | $939.0M | up 10.5% year-over-year, 10.7% in constant currency |
| Trailing 12-month bookings | $28.7 billion | up 4% year-over-year |
| Total headcount | 359,900 | up 10,100 from September 30, 2025 |
Where each number comes from
- Revenue: “Revenue of $5.7 billion increased 4.6% year-over-year or 4.8% in constant currency1”
- Net income: “Net income | $627 | $274 | $1,925 | $1,582 Basic earnings per share | $1.39 | $0.56 | $4.15 | $3.22”
- GAAP diluted EPS: “GAAP EPS2 of $1.39 increased 148% year-over-year; Adjusted EPS1 of $1.49 increased 7.2% year-over-year”
- Adjusted diluted EPS: “GAAP EPS2 of $1.39 increased 148% year-over-year; Adjusted EPS1 of $1.49 increased 7.2% year-over-year”
- Income from operations: “Depreciation and amortization expense | 149 | 135 | 433 | 410 (Gain) on sale of property and equipment | — | — | — | (62) Income from operations | 872 | 866 | 2,589 | 2,536”
- GAAP operating margin: “Operating margin of 15.4% decreased 60 basis points year-over-year; Adjusted Operating Margin1 of 16.3% increased 30 basis points year-over-year”
- Adjusted operating margin: “Operating margin of 15.4% decreased 60 basis points year-over-year; Adjusted Operating Margin1 of 16.3% increased 30 basis points year-over-year”
- Operating cash flow: “Net cash provided by operating activities | $1,004 | $1,227 | $1,836 | $2,025 Purchases of property and equipment | (79) | (67) | (254) | (211)”
- Financial Services: “Health Sciences | $1,587 | 28.0% | (1.1)% | (0.9)% Financial Services | 1,767 | 31.2% | 12.0% | 12.3% Products and Resources | 1,371 | 24.2%”
- Health Sciences: “Health Sciences | $1,587 | 28.0% | (1.1)% | (0.9)% Financial Services | 1,767 | 31.2% | 12.0% | 12.3% Products and Resources | 1,371 | 24.2%”
- Products and Resources: “Health Sciences | $1,587 | 28.0% | (1.1)% | (0.9)% Financial Services | 1,767 | 31.2% | 12.0% | 12.3% Products and Resources | 1,371 | 24.2%”
- Communications, Media and Technology: “Products and Resources | 1,371 | 24.2% | (0.9)% | (0.8)% Communications, Media and Technology | 939 | 16.6% | 10.5% | 10.7% Total Revenues (b)(c) | $5,664”
- Trailing 12-month bookings: “On a trailing-twelve-month basis, bookings increased 4% year-over-year to $28.7 billion, which represented a book-to-bill of approximately 1.3x.”
- Total headcount: “Total headcount as of September 30, 2026 was 359,900, an increase of 3,200 from June 30, 2026 and an increase of 10,100 from September 30, 2025.”
Copied from the press release ↗ and other documents in the SEC filing ↗. A figure is published only if its sentence is in those documents.
| From the filing | Q3 2026 | vs year ago | vs last quarter |
|---|---|---|---|
| Revenue | $5.7B | +4.6% | +3.3% |
| Operating income | $872.0M | +0.7% | −0.2% |
| Net income | $627.0M | +128.8% | −1.4% |
| Diluted EPS | $1.39 | +148.2% | +2.2% |
| Free cash flow | $925.0M | −20.3% | +101.5% |
| Operating margin | 15.4% | −0.6 pts | −0.5 pts |
Calculated by code from XBRL, not by the model.
Guidance check
| Metric | Outlook given with Q2 2026 | Reported | Result |
|---|---|---|---|
| Revenue | $5.60 to $5.68 billion | $5.7B | within the range |
Compared with the company's own guidance, not analyst estimates, and only where the outlook and the reported figure are the same measure on the same basis. Ranges are worked out by code from the company's wording. How this works.
Outlook
| Metric | Period | Outlook |
|---|---|---|
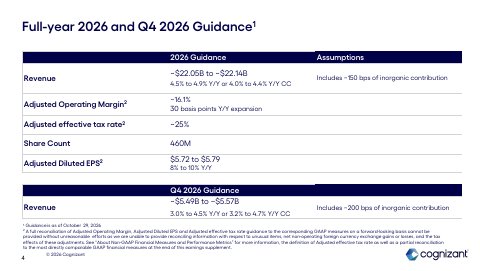
| Q4 revenue | fourth quarter of 2026 | $5.49 to $5.57 billion |
| Full-year revenue | full-year 2026 | $22.05 to $22.14 billion |
| Full-year constant currency revenue growth | full-year 2026 | 4.0% to 4.4% |
| Full-year adjusted operating margin | full-year 2026 | approximately 16.1% |
| Full-year adjusted diluted EPS | full-year 2026 | $5.72 to $5.79 |
| Adjusted effective tax rate | full-year 2026 | ~25% |
| Project Leap total costs | total Project Leap program | $180 million to $250 million |
Key takeaways
AI Nexus and Activate extend the AI Builder strategy
Cognizant launched AI Nexus, a multi-model layer to meter AI spend, govern quality and document results, plus Activate, a unit selling pre-configured AI kits to emerging enterprises. Together they move the company from services toward reusable platforms and a new customer segment.
Google Cloud partnership adds 18,000 dedicated associates
A new Gemini Frontier Capability Group pairs Google's AI platform with Cognizant's domain and engineering expertise. The size of the dedicated team signals how heavily Cognizant is committing delivery capacity to a single partner ecosystem.
Agentic AI is reaching production at clients
A seven-person Cognizant team used Devin to convert Odyssey Logistics' legacy systems, raising delivery throughput by roughly a third and producing a 37 percent net cost saving. TriZetto Facets and QNXT also gained generally available agents that process routine pending claims and route exceptions to human reviewers.
Financial Services and CMT grew while others shrank
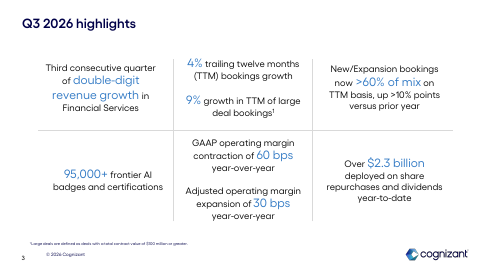
Financial Services grew 12.0% for a third straight double-digit quarter, and Communications, Media & Technology grew 10.5%, helped by acquisitions and third-party product sales. Health Sciences and Products and Resources both declined, and management cited macro pressure on healthcare and consumer-facing sectors.
Weaker bookings and Project Leap costs temper the AI push
Third-quarter bookings fell 7% year over year, with three large deals signed, and Project Leap costs were raised to $180 million to $250 million. Trailing-twelve-month bookings still grew 4%, and new and expansion work is now over 60% of the mix.
Charts
Fourth quarter worked out from the annual figure.
Data
| Q4 2024 | $5.1B * |
| Q1 2025 | $5.1B |
| Q2 2025 | $5.2B |
| Q3 2025 | $5.4B |
| Q4 2025 | $5.3B * |
| Q1 2026 | $5.4B |
| Q2 2026 | $5.5B |
| Q3 2026 | $5.7B |
Data
| Q1 2025 | $1.34 |
| Q2 2025 | $1.31 |
| Q3 2025 | $0.56 |
| Q1 2026 | $1.39 |
| Q2 2026 | $1.36 |
| Q3 2026 | $1.39 |
Fourth-quarter EPS appears once the press release is read; filings report it only for the full year.
Data
| Q4 2024 | 14.8% |
| Q1 2025 | 16.7% |
| Q2 2025 | 15.6% |
| Q3 2025 | 16.0% |
| Q4 2025 | 16.0% |
| Q1 2026 | 15.6% |
| Q2 2026 | 15.9% |
| Q3 2026 | 15.4% |
Data
| Q4 2024 | $837.0M |
| Q1 2025 | $323.0M |
| Q2 2025 | $331.0M |
| Q3 2025 | $1.2B |
| Q4 2025 | $781.0M |
| Q1 2026 | $198.0M |
| Q2 2026 | $459.0M |
| Q3 2026 | $925.0M |
Operating cash flow minus capital expenditure, from cash flow statements.
Questions
What did Cognizant launch this quarter?
It launched Cognizant AI Nexus, a modular multi-model layer for metering, governing and documenting AI spend, and Cognizant Activate, a business unit offering pre-configured AI solution kits to emerging enterprises. It also made agentic claims-processing capabilities generally available on TriZetto Facets and QNXT.
How is Cognizant using partnerships to push AI?
It expanded with Google Cloud through a Gemini Frontier Capability Group of 18,000 associates and with CrowdStrike on an OT security service. It also ran a Codex hackathon with OpenAI and continued its AI transformation work with Travelport alongside Anthropic.
Which parts of the business are growing and which are weak?
Financial Services grew 12.0% and Communications, Media & Technology 10.5%, while Health Sciences fell 1.1% and Products and Resources fell 0.9%. Acquisitions added about 210 basis points to overall growth.
What acquisitions is Cognizant making?
It signed a definitive agreement to acquire DyFlex Solutions, an Australian SAP Platinum Partner, to strengthen its SAP, enterprise platform and AI capabilities in Australia and New Zealand. Recently completed deals, including 3Cloud and Astreya, contributed to growth this quarter.
What are the main risks to Cognizant's strategy?
Management says macro uncertainty is hitting healthcare and consumer-facing sectors and weighing on discretionary spending in Q4. Third-quarter bookings fell 7%, and the Project Leap restructuring is now expected to cost more than first planned.
Call recording
Call recording on YouTube ↗. Official replay ↗.