
Cognizant (CTSH) · IT Services
Cognizant Q2 2026 earnings: summary, key numbers & outlook
Results filed 29 Jul 2026 · Quarter ended 30 Jun 2026
Slides (20 pages)Official transcript (PDF) ↗Press release ↗Investor relations ↗
Summaries and transcripts are machine-generated and can contain errors.
In brief
Cognizant is repositioning as an AI builder, pairing a Frontier-certified workforce with an expanded Anthropic partnership and the Astreya acquisition, while Financial Services grew 12.0%.
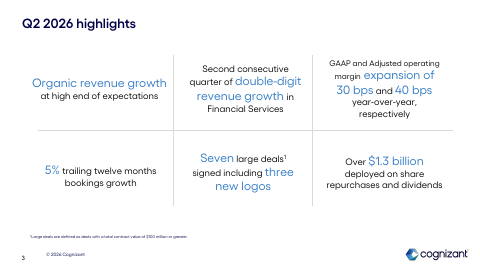
Cognizant's Financial Services segment, its largest, grew in double digits for a second straight quarter, while the other three segments grew only 1% to 2%. The company completed its Astreya acquisition, expanded partnerships with Anthropic, Google Cloud, OpenAI, ServiceNow, Snowflake and CrowdStrike, and launched Neuro AI Trust, Secure AI Services and a sovereign Physical AI Platform-as-a-Service. Seven large deals were signed, including three new logos.
Management is steering toward AI-builder services built on a certified workforce, with plans for 5,000 Frontier Certified Engineers and 10,000 Frontier Business Operators, the first cohort expected by the fourth quarter of 2026. The tension is that growth is uneven across segments, second-quarter bookings fell 6%, and voluntary attrition rose, which could slow the talent build-out. Acquisitions and third-party product resale also contribute to growth.
No call transcript for this quarter, so this summary also draws on: The Motley Fool ↗.
Slides & documents
Open the slide deck (PDF, 20 pages) ↗

Showing the first 6 of 20 pages.
From Cognizant investor relations
- TranscriptCompany's official transcript ↗
- WebcastWebcast replay ↗
- InfographicDocument ↗
- Form 10-QDocument ↗
SEC filing
Key numbers
- Revenue · GAAP
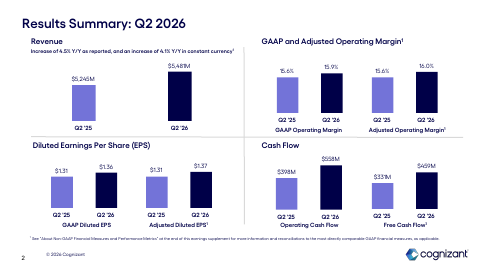
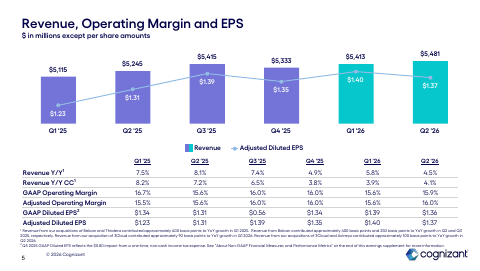
- $5.5 billion
- Net income · GAAP
- $636.0M
- GAAP diluted EPS · GAAP
- $1.36
- Adjusted diluted EPS · non-GAAP
- $1.37
- GAAP operating margin · GAAP
- 15.9%
- Adjusted operating margin · non-GAAP
- 16.0%
- GAAP income from operations · GAAP
- $874.0M
- Cash flow from operations · GAAP
- $558M
up 4.5% year-over-year, or 4.1% in constant currency
compared with $645 in Q2 2025
up 3.8% year-over-year
up 4.6% year-over-year
up 30 basis points year-over-year
up 40 basis points year-over-year
compared with $817 in Q2 2025
| Segment or metric | Value | Change |
|---|---|---|
| Financial Services | 1.7B | up 12.0% year-over-year, 11.7% in constant currency |
| Health Sciences | $1.6B | up 1.4% year-over-year, 1.0% in constant currency |
| Products and Resources | 1.3B | up 1.2% year-over-year, 0.7% in constant currency |
| Communications, Media and Technology | 854.0M | up 1.5% year-over-year, 1.4% in constant currency |
| Trailing 12-month bookings | $29.1 billion | up 5% year-over-year; Q2 bookings declined 6% |
| Total headcount | 356,700 | down 900 from March 31, 2026; up 12,900 from June 30, 2025 |
Where each number comes from
- Revenue: “Revenue of $5.5 billion increased 4.5% year-over-year or 4.1% in constant currency1”
- Net income: “Income (loss) from equity method investments | (8) | — | (5) | 4 Net income | $636 | $645 | $1,298 | $1,308”
- GAAP diluted EPS: “GAAP EPS of $1.36 increased 3.8% year-over-year; Adjusted EPS1 of $1.37 increased 4.6% year-over-year”
- Adjusted diluted EPS: “GAAP EPS of $1.36 increased 3.8% year-over-year; Adjusted EPS1 of $1.37 increased 4.6% year-over-year”
- GAAP operating margin: “Operating margin of 15.9% increased 30 basis points year-over-year; Adjusted Operating Margin1 of 16.0% increased 40 basis points year-over-year”
- Adjusted operating margin: “Operating margin of 15.9% increased 30 basis points year-over-year; Adjusted Operating Margin1 of 16.0% increased 40 basis points year-over-year”
- GAAP income from operations: “GAAP income from operations | $874 | $817 | $1,717 | $1,670 Project Leap charges(a) | 84 | — | 84”
- Cash flow from operations: “Q2 2026 Cash Flow Cash Flow From Operations $558M Free Cash Flow $459M Q2 2026 Capital Return”
- Financial Services: “Health Sciences | $1,572 | 28.7% | 1.4% | 1.0% Financial Services (c) | 1,733 | 31.6% | 12.0% | 11.7%”
- Health Sciences: “Health Sciences | $1,572 | 28.7% | 1.4% | 1.0% Financial Services (c) | 1,733 | 31.6% | 12.0% | 11.7%”
- Products and Resources: “Products and Resources (c) | 1,322 | 24.1% | 1.2% | 0.7% Communications, Media and Technology (c) | 854 | 15.6% | 1.5% | 1.4%”
- Communications, Media and Technology: “Products and Resources (c) | 1,322 | 24.1% | 1.2% | 0.7% Communications, Media and Technology (c) | 854 | 15.6% | 1.5% | 1.4%”
- Trailing 12-month bookings: “On a trailing-twelve-month basis, bookings increased 5% year-over-year to $29.1 billion, which represented a book-to-bill of approximately 1.3x.”
- Total headcount: “Total headcount as of June 30, 2026 was 356,700, a decrease of 900 from March 31, 2026 and an increase of 12,900 from June 30, 2025.”
Copied from the press release ↗ and other documents in the SEC filing ↗. A figure is published only if its sentence is in those documents.
| From the filing | Q2 2026 | vs year ago | vs last quarter |
|---|---|---|---|
| Revenue | $5.5B | +4.5% | +1.3% |
| Operating income | $874.0M | +7.0% | +3.7% |
| Net income | $636.0M | −1.4% | −3.9% |
| Diluted EPS | $1.36 | +3.8% | −2.2% |
| Free cash flow | $459.0M | +38.7% | +131.8% |
| Operating margin | 15.9% | +0.3 pts | +0.3 pts |
Calculated by code from XBRL, not by the model.
Outlook
| Metric | Period | Outlook |
|---|---|---|
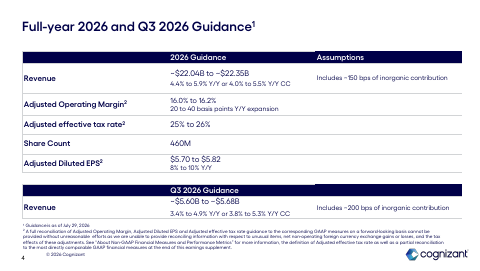
| Q3 revenue | third quarter of 2026 | $5.60 to $5.68 billion |
| Full-year revenue | full-year 2026 | $22.04 to $22.35 billion |
| Full-year constant currency revenue growth | full-year 2026 | 4.0% to 5.5% |
| Adjusted operating margin | full-year 2026 | 16.0% to 16.2% |
| Adjusted diluted EPS | full-year 2026 | $5.70 to $5.82 |
| Adjusted effective tax rate | full-year 2026 | 25% to 26% |
Key takeaways
Financial Services drives growth as other segments lag
Financial Services grew 12.0% year over year, a second consecutive double-digit quarter, while Health Sciences, Products and Resources, and Communications, Media and Technology each grew 1.5% or less. Growth is concentrated in one segment.
Anthropic partnership deepens with Claude-certified workforce
Cognizant became one of a small number of Global Premier Partners in the Claude Partner Network. It is embedding Claude in its own platforms and already applying it in client work across manufacturing, life sciences and insurance.
Frontier workforce model creates two new job categories
Cognizant plans 5,000 Frontier Certified Engineers and 10,000 Frontier Business Operators, with the first cohort expected by the fourth quarter of 2026. This is how it intends to turn AI capability into client results.
Astreya acquisition adds AI infrastructure and managed services
Cognizant completed the Astreya deal effective June 22, 2026. Astreya supports many of the world's largest technology companies, including six of the "Magnificent Seven" hyperscalers, strengthening AI infrastructure and managed services.
New trust and sovereign AI products target enterprise governance
Cognizant launched Neuro AI Trust, Secure AI Services and a sovereign Physical AI Platform-as-a-Service, and partnered with Domyn for sovereign AI in EMEA. These address enterprises' need to govern and secure autonomous AI systems.
Charts
Fourth quarter worked out from the annual figure.
Data
| Q4 2024 | $5.1B * |
| Q1 2025 | $5.1B |
| Q2 2025 | $5.2B |
| Q3 2025 | $5.4B |
| Q4 2025 | $5.3B * |
| Q1 2026 | $5.4B |
| Q2 2026 | $5.5B |
| Q3 2026 | $5.7B |
Data
| Q1 2025 | $1.34 |
| Q2 2025 | $1.31 |
| Q3 2025 | $0.56 |
| Q1 2026 | $1.39 |
| Q2 2026 | $1.36 |
| Q3 2026 | $1.39 |
Fourth-quarter EPS appears once the press release is read; filings report it only for the full year.
Data
| Q4 2024 | 14.8% |
| Q1 2025 | 16.7% |
| Q2 2025 | 15.6% |
| Q3 2025 | 16.0% |
| Q4 2025 | 16.0% |
| Q1 2026 | 15.6% |
| Q2 2026 | 15.9% |
| Q3 2026 | 15.4% |
Data
| Q4 2024 | $837.0M |
| Q1 2025 | $323.0M |
| Q2 2025 | $331.0M |
| Q3 2025 | $1.2B |
| Q4 2025 | $781.0M |
| Q1 2026 | $198.0M |
| Q2 2026 | $459.0M |
| Q3 2026 | $925.0M |
Operating cash flow minus capital expenditure, from cash flow statements.
Questions
What was the main product and strategy news from Cognizant this quarter?
Cognizant expanded its Anthropic partnership, completed the Astreya acquisition, and launched Neuro AI Trust, Secure AI Services and a sovereign Physical AI Platform-as-a-Service. It also announced a Frontier-certified workforce model.
Which Cognizant segment is growing fastest?
Financial Services grew 12.0% year over year, its second consecutive double-digit quarter. The other three segments grew between 1.2% and 1.5%.
How is Cognizant working with AI model providers?
It is a Global Premier Partner in the Claude Partner Network, expanded its Google Cloud partnership around Gemini Enterprise, and is applying OpenAI's GPT-5.5 in its Frontier AI Cyber Defense services.
What does Cognizant plan for its workforce?
It plans to scale to 5,000 Frontier Certified Engineers and 10,000 Frontier Business Operators, with the first cohort expected by the fourth quarter of 2026. It also launched an Ace Team Program and plans annual direct hires of Frontier-native university talent.
What signals of demand and risk appeared in the quarter?
Seven large deals were signed, including three new logos, and trailing twelve-month bookings rose 5%. However, second-quarter bookings fell 6% year over year and voluntary attrition rose to 13.0%.