
Cencora (COR) · Health Care
Cencora Q4 FY2026 earnings: summary, key numbers & outlook
Results filed 4 Nov 2026 · Quarter ended 29 Sep 2026
Slides (23 pages)Press release ↗Investor relations ↗
Summaries and transcripts are machine-generated and can contain errors.
In brief
Cencora is reorganizing into two customer-focused segments and buying American Oncology Network, deepening its bet on specialty and oncology physician practices after closing OneOncology.
Cencora closed its OneOncology acquisition in February 2026, adding a physician-practice platform that lifted U.S. profitability. Specialty product sales to health systems and physician practices grew, as did GLP-1 sales, which carry lower margins. Brand manufacturer price declines and lower sales to its large mail order customer partly offset growth. It also sold U.S. Consulting Services in April 2026.
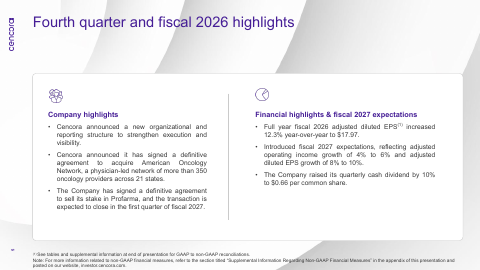
Management is moving to a new operating model with Pharmaceutical Distribution and Services and Specialty Pharmaceutical and Provider Services segments, and plans to add American Oncology Network, a network of more than 350 oncology providers across 21 states. It is also selling Profarma and expects MWI Animal Health to merge with Covetrus. The tension is integrating several acquisitions and divestitures while GLP-1 mix dilutes distribution margins.
Slides & documents
Open the slide deck (PDF, 23 pages) ↗


Showing the first 6 of 23 pages.
From Cencora investor relations
SEC filing
Key numbers
- Q4 revenue · GAAP
- $88.4 billion
- Q4 diluted EPS · GAAP
- $2.71
- Q4 adjusted diluted EPS · non-GAAP
- $4.66
- Q4 adjusted operating income · non-GAAP
- $1.2 billion
- FY2026 operating cash flow · GAAP
- $4,790M
up 5.5 percent
compared to $(1.75) in the prior year quarter
increased 21.4 percent
22.1 percent increase
| Segment or metric | Value | Change |
|---|---|---|
| U.S. Healthcare Solutions revenue | $78.3 billion | up 5.4 percent |
| International Healthcare Solutions revenue | $7.8 billion | up 5.1 percent |
| Other revenue | $2.3 billion | up 10.1% |
Where each number comes from
- Q4 revenue: “in its fiscal year 2026 fourth quarter ended September 30, 2026, revenue increased 5.5 percent to $88.4 billion.”
- Q4 diluted EPS: “diluted earnings per share (EPS) was $2.71 for the fourth quarter of fiscal 2026, compared to $(1.75) in the prior year quarter.”
- Q4 adjusted diluted EPS: “Adjusted diluted EPS, which is a non-GAAP measure that excludes items described below, increased 21.4 percent to $4.66 in the fiscal fourth quarter.”
- Q4 adjusted operating income: “adjusted operating income was $1.2 billion, a 22.1 percent increase compared to the same quarter in the prior fiscal year”
- FY2026 operating cash flow: “Reconciliation of adjusted free cash flows Operating cash flows | $4,790M Capital expenditures | $(910)M Free cash flows | $3,881M”
- U.S. Healthcare Solutions revenue: “U.S. Healthcare Solutions revenue was $78.3 billion in the fourth quarter of fiscal 2026, an increase of 5.4 percent compared to the same quarter in the previous fiscal year”
- International Healthcare Solutions revenue: “International Healthcare Solutions revenue was $7.8 billion in the fourth quarter of fiscal 2026, an increase of 5.1 percent compared to the same period in the prior fiscal year”
- Other revenue: “Revenue in Other was $2.3 billion in the fourth quarter of fiscal 2026, an increase of 10.1% compared to the same period in the prior fiscal year”
Copied from the press release ↗ and other documents in the SEC filing ↗. A figure is published only if its sentence is in those documents.
XBRL figures for this quarter arrive with the 10-Q or 10-K; the numbers above are from the press release.
Outlook
| Metric | Period | Outlook |
|---|---|---|
| Revenue growth | fiscal 2027 | 3% to 5% growth |
| Adjusted diluted EPS | fiscal 2027 | $19.40 to $19.75 |
| Adjusted operating income growth | fiscal 2027 | 4% to 6% growth |
| Net interest expense | fiscal 2027 | $490M to $510M |
| Adjusted effective tax rate | fiscal 2027 | ~20% |
| Adjusted free cash flow | fiscal 2027 | ~$3.5B |
| Capital expenditures | fiscal 2027 | ~$1.0B |
Key takeaways
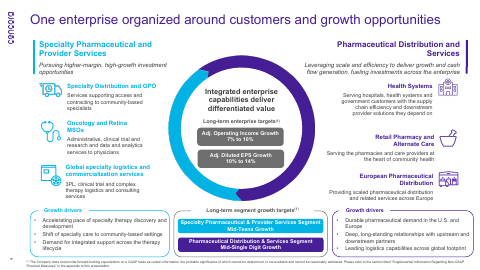
Cencora restructures into two customer-focused segments
From fiscal 2027 it will report Pharmaceutical Distribution and Services and Specialty Pharmaceutical and Provider Services, plus Other. Management says the model is meant to strengthen execution and improve visibility.
American Oncology Network deal extends oncology push
Cencora signed a definitive agreement to acquire a physician-led network of more than 350 oncology providers across 21 states. It follows the February 2026 OneOncology acquisition.
Specialty and physician practice demand drives U.S. volume
U.S. growth came from unit volume, including specialty products sold to health systems and physician practices, plus GLP-1 products. Brand manufacturer price declines and lower sales to its large mail order customer partly offset this.
GLP-1 growth dilutes distribution margins
Increased GLP-1 sales carry lower gross profit margins and partly offset the margin benefit from OneOncology. This shows the mix tension in core distribution.
Portfolio pruning continues with Profarma and MWI
Cencora signed to sell its Profarma stake, expected to close in the first quarter of fiscal 2027, and assumes MWI Animal Health merges with Covetrus by March 31, 2027. It divested U.S. Consulting Services in April 2026.
Charts
Fourth quarter worked out from the annual figure.
Data
| Q4 FY24 | $79.1B * |
| Q1 FY25 | $81.5B |
| Q2 FY25 | $75.5B |
| Q3 FY25 | $80.7B |
| Q4 FY25 | $83.7B * |
| Q1 FY26 | $85.9B |
| Q2 FY26 | $78.4B |
| Q3 FY26 | $84.8B |
Data
| Q1 FY25 | $2.50 |
| Q2 FY25 | $3.68 |
| Q3 FY25 | $3.52 |
| Q1 FY26 | $2.87 |
| Q2 FY26 | $8.40 |
| Q3 FY26 | $3.94 |
Fourth-quarter EPS appears once the press release is read; filings report it only for the full year.
Data
| Q4 FY24 | 0.2% |
| Q1 FY25 | 0.9% |
| Q2 FY25 | 1.4% |
| Q3 FY25 | 1.1% |
| Q4 FY25 | 0.0% |
| Q1 FY26 | 0.9% |
| Q2 FY26 | 1.5% |
| Q3 FY26 | 1.3% |
Data
| Q4 FY24 | $818.1M |
| Q1 FY25 | -$2.8B |
| Q2 FY25 | $3.2B |
| Q3 FY25 | -$74.0M |
| Q4 FY25 | $2.9B |
| Q1 FY26 | -$2.4B |
| Q2 FY26 | $1.2B |
| Q3 FY26 | $2.4B |
Operating cash flow minus capital expenditure, from cash flow statements.
Questions
What is Cencora's new segment structure?
Starting in the first quarter of fiscal 2027, it will report Pharmaceutical Distribution and Services, Specialty Pharmaceutical and Provider Services, and Other. The specialty segment covers physician practice and MSO services, World Courier, 3PL, Innomar and parts of PharmaLex.
What acquisition did Cencora announce?
It signed a definitive agreement to acquire American Oncology Network, a physician-led network of more than 350 oncology providers across 21 states. This builds on the OneOncology acquisition completed in February 2026.
What is driving U.S. demand?
Unit volume growth, including specialty product sales to health systems and physician practices and GLP-1 products. Lower brand manufacturer prices and reduced sales to its large mail order customer partly offset it.
What is happening to Profarma and MWI Animal Health?
Cencora signed to sell its Profarma stake, expected to close in the first quarter of fiscal 2027. Its fiscal 2027 outlook assumes the MWI Animal Health merger with Covetrus closes March 31, 2027.
What are Cencora's long-term segment targets?
It targets mid-single digit operating income growth for Pharmaceutical Distribution and Services and mid-teens for Specialty Pharmaceutical and Provider Services. It reaffirmed 7% to 10% adjusted operating income growth overall.
Call recording
Call recording on YouTube ↗. Official replay ↗.