
Cencora (COR) · Health Care
Cencora Q3 FY2026 earnings: summary, key numbers & outlook
Results filed 5 Aug 2026 · Quarter ended 30 Jun 2026
Slides (18 pages)Press release ↗Investor relations ↗
Summaries and transcripts are machine-generated and can contain errors.
In brief
Cencora closed its OneOncology acquisition in February 2026, deepening its specialty and oncology reach while GLP-1 volume and an oncology customer loss reshape U.S. demand.
Cencora completed the February 2026 acquisition of OneOncology, adding oncology practice relationships to its specialty business. U.S. demand grew on unit volume, including specialty products sold to health systems and physician practices and GLP-1 products for diabetes and weight loss. Offsetting this were lower brand manufacturer prices, the 2025 loss of an oncology customer and lower sales to its large mail order customer. In April 2026 it divested U.S. Consulting Services.
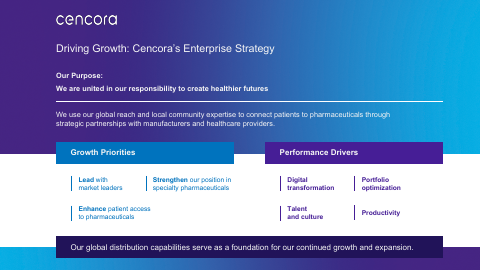
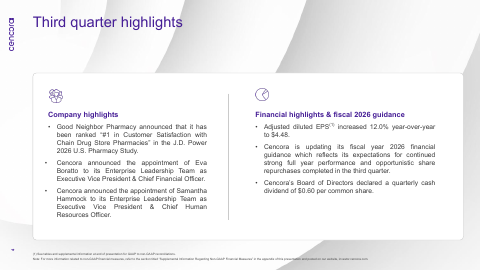
Management is steering toward a pharmaceutical-centric strategy built on specialty, digital transformation and talent, while exploring strategic alternatives for MWI Animal Health, Profarma and parts of PharmaLex. The tension is mix: GLP-1s carry lower gross margins, and the acquisition was financed with senior notes and term loans, raising interest costs. A new CFO and Chief Human Resources Officer have also joined the leadership team.
Slides & documents
Open the slide deck (PDF, 18 pages) ↗


Showing the first 6 of 18 pages.
From Cencora investor relations
SEC filing
Key numbers
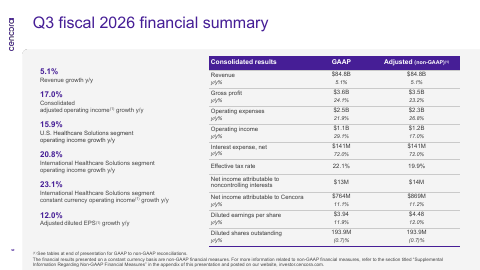
- Revenue · GAAP
- $84.8 billion
- Diluted EPS · GAAP
- $3.94
- Adjusted diluted EPS · non-GAAP
- $4.48
- Net income attributable to Cencora · GAAP
- $764M
- Operating income · GAAP
- $1.1B
up 5.1% from a year ago
up from $3.52 a year ago
up 12.0% from $4.00
up 29.1% from a year ago
| Segment or metric | Value | Change |
|---|---|---|
| U.S. Healthcare Solutions revenue | $74.9 billion | up 4.9% |
| International Healthcare Solutions revenue | $7.7 billion | up 5.9% |
| Other revenue | $2.3 billion | up 6.9% |
Where each number comes from
- Revenue: “in its fiscal year 2026 third quarter ended June 30, 2026, revenue increased 5.1 percent year-over-year to $84.8 billion.”
- Diluted EPS: “diluted earnings per share (EPS) was $3.94 for the third quarter of fiscal 2026 compared to $3.52 in the prior year third quarter.”
- Adjusted diluted EPS: “Adjusted diluted EPS, which is a non-GAAP financial measure that excludes items described below, increased 12.0 percent to $4.48 in the fiscal third quarter from $4.00”
- Net income attributable to Cencora: “Net Income Attributable to Cencora, Inc. | $764M | $869M Diluted Earnings Per Share | $3.94 | $4.48”
- Operating income: “In the third quarter of fiscal 2026, operating income was $1.1 billion, an increase of 29.1 percent compared to the same quarter in the previous fiscal year”
- U.S. Healthcare Solutions revenue: “U.S. Healthcare Solutions revenue was $74.9 billion in the third quarter of fiscal 2026, an increase of 4.9 percent compared to the same quarter of the previous fiscal year”
- International Healthcare Solutions revenue: “International Healthcare Solutions revenue was $7.7 billion in the third quarter of fiscal 2026, an increase of 5.9 percent compared to the previous fiscal year’s third quarter”
- Other revenue: “Revenue in Other was $2.3 billion in the third quarter of fiscal 2026, an increase of 6.9 percent compared to the previous fiscal year’s third quarter”
Copied from the press release ↗ and other documents in the SEC filing ↗. A figure is published only if its sentence is in those documents.
| From the filing | Q3 FY2026 | vs year ago | vs last quarter |
|---|---|---|---|
| Revenue | $84.8B | +5.1% | +8.2% |
| Operating income | $1.1B | +29.1% | −2.0% |
| Net income | $763.5M | +11.1% | −53.5% |
| Diluted EPS | $3.94 | +11.9% | −53.1% |
| Free cash flow | $2.4B | — | +107.0% |
| Gross margin | 4.3% | +0.7 pts | −0.3 pts |
| Operating margin | 1.3% | +0.2 pts | −0.2 pts |
Calculated by code from XBRL, not by the model.
Outlook
| Metric | Period | Outlook |
|---|---|---|
| Adjusted diluted EPS | fiscal 2026 | $17.75 to $17.95 |
| Revenue growth | fiscal 2026 | 4% to 6% growth |
| Adjusted operating income growth | fiscal 2026 | 13% to 14% growth |
| Adjusted effective tax rate | fiscal 2026 | ~20% |
| Capital expenditures | fiscal 2026 | ~$900M |
Key takeaways
OneOncology deal deepens oncology and specialty reach
The February 2026 acquisition lifted U.S. gross margin and added operating expenses. It extends Cencora's specialty position with physician practices.
Specialty and GLP-1 volume drive U.S. demand
U.S. growth came largely from unit volume, including specialty products to health systems and physician practices and GLP-1 products. GLP-1s carry lower gross profit margins.
Customer losses are a partial drag
The 2025 loss of an oncology customer and lower sales to the large mail order customer offset growth, as expected and consistent with the second quarter.
Portfolio pruning continues with divestiture and reviews
U.S. Consulting Services was divested in April 2026, and MWI Animal Health, Profarma and parts of PharmaLex are under strategic alternatives review.
Buyback pulled forward; guidance raised
Cencora repurchased $1 billion of shares, the amount it had expected to complete by end of calendar 2026, and raised its adjusted EPS range.
Charts
Fourth quarter worked out from the annual figure.
Data
| Q4 FY24 | $79.1B * |
| Q1 FY25 | $81.5B |
| Q2 FY25 | $75.5B |
| Q3 FY25 | $80.7B |
| Q4 FY25 | $83.7B * |
| Q1 FY26 | $85.9B |
| Q2 FY26 | $78.4B |
| Q3 FY26 | $84.8B |
Data
| Q1 FY25 | $2.50 |
| Q2 FY25 | $3.68 |
| Q3 FY25 | $3.52 |
| Q1 FY26 | $2.87 |
| Q2 FY26 | $8.40 |
| Q3 FY26 | $3.94 |
Fourth-quarter EPS appears once the press release is read; filings report it only for the full year.
Data
| Q4 FY24 | 0.2% |
| Q1 FY25 | 0.9% |
| Q2 FY25 | 1.4% |
| Q3 FY25 | 1.1% |
| Q4 FY25 | 0.0% |
| Q1 FY26 | 0.9% |
| Q2 FY26 | 1.5% |
| Q3 FY26 | 1.3% |
Data
| Q4 FY24 | $818.1M |
| Q1 FY25 | -$2.8B |
| Q2 FY25 | $3.2B |
| Q3 FY25 | -$74.0M |
| Q4 FY25 | $2.9B |
| Q1 FY26 | -$2.4B |
| Q2 FY26 | $1.2B |
| Q3 FY26 | $2.4B |
Operating cash flow minus capital expenditure, from cash flow statements.
Questions
What did Cencora acquire and how did it affect the quarter?
Cencora acquired OneOncology in February 2026, which raised U.S. Healthcare Solutions gross margin and operating expenses and was financed partly with senior notes and term loans.
What is driving U.S. demand?
Unit volume growth, including specialty products sold to health systems and physician practices and GLP-1 products for diabetes and weight loss.
Which customers weighed on U.S. sales?
The 2025 loss of an oncology customer and lower sales to its large mail order customer, partly offset growth.
What is happening with non-core businesses?
U.S. Consulting Services was divested in April 2026, and MWI Animal Health, Profarma and certain PharmaLex components are being explored for strategic alternatives.
How did Cencora change its outlook?
It raised adjusted diluted EPS guidance to $17.75 to $17.95 from $17.70 to $17.90 and narrowed adjusted operating income growth to 13% to 14%, after repurchasing $1 billion of shares.