
Franklin Templeton (BEN) · Asset Management
Franklin Templeton Q4 FY2026 earnings: summary, key numbers & outlook
Results filed 6 Nov 2026 · Quarter ended 30 Sep 2026
Slides (36 pages)Press release ↗Investor relations ↗
Summaries and transcripts are machine-generated and can contain errors.
In brief
Franklin Templeton's push into alternatives, ETFs and customized portfolios drove $84.1 billion of full-year long-term net inflows, and it is buying more private-markets capacity.
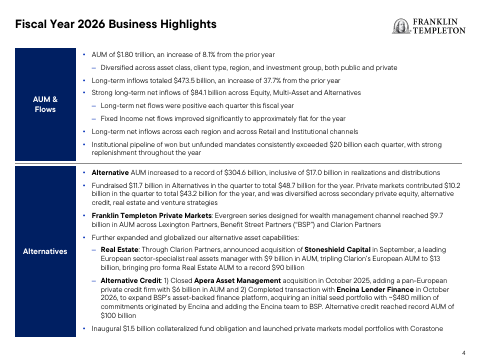
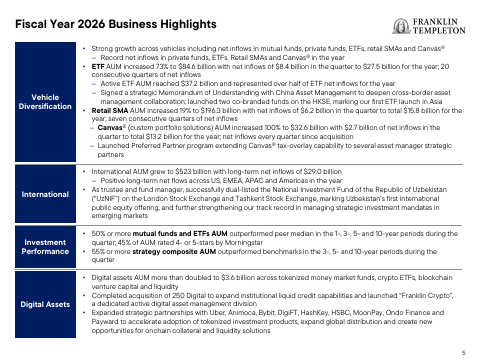
Franklin Templeton had positive long-term net flows in every quarter of fiscal 2026, across all regions and in both retail and institutional channels. Alternatives, ETFs, retail separately managed accounts (SMAs) and Canvas, its custom portfolio product, all reached record assets. Alternative AUM hit $304.6 billion, and the institutional pipeline of won-but-unfunded mandates stood at $22.0 billion. Management also grew its digital assets business, adding a dedicated crypto management division.
Management is steering toward private markets, customized solutions and new investment vehicles. It plans to keep buying alternatives capability, including Stoneshield in European real estate and Encina in asset-backed finance, and targets an adjusted operating margin of about 30% in fiscal 2027, two years ahead of plan. The tension is that these acquisitions and strategic investments must be funded while fixed income flows stay roughly flat and Western Asset outflows continue.
Slides & documents
Open the slide deck (PDF, 36 pages) ↗
Showing the first 6 of 36 pages.
From Franklin Templeton investor relations
SEC filing
Key numbers
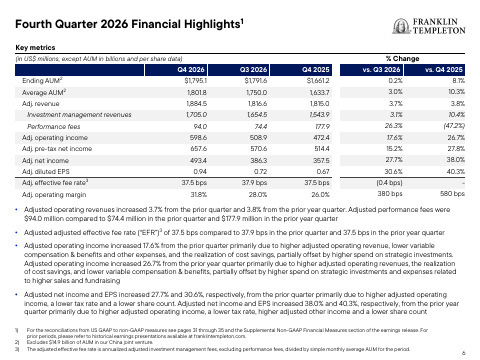
- Operating revenues · GAAP
- $2.4B
- Net income attributable to Franklin Templeton · GAAP
- $380.1 million
- Diluted EPS · GAAP
- $0.72
- Adjusted diluted EPS · non-GAAP
- $0.94
- Operating income · GAAP
- $355.8 million
- Operating margin · GAAP
- 14.6%
- Adjusted operating margin · non-GAAP
- 31.8%
up 4% from a year ago
up from $117.6 million a year ago
up from $0.21 a year ago
up from $0.67 a year ago
up from $85.4 million a year ago
up from 3.6% a year ago
up from 26.0% a year ago
| Segment or metric | Value | Change |
|---|---|---|
| Total AUM | $1.8 trillion | up 8% year over year |
| Quarterly long-term net inflows | $20.8 billion | full year $84.1 billion |
| Alternative AUM | $304.6 billion | record; $48.7 billion fundraised in the year |
| ETF AUM | $84.6 billion | up 73% |
| Retail SMA AUM | $196.3 billion | up 19% |
| Canvas AUM | $32.6 billion | up 100% |
| Institutional pipeline (won but unfunded) | $22.0 billion | |
| Digital assets AUM | $3.6 billion | more than doubled |
Where each number comes from
- Operating revenues: “Operating revenues | $2,434.9 | $2,358.4 | 3% | $2,343.7 | 4% | $9,415.3 | $8,770.7 | 7%”
- Net income attributable to Franklin Templeton: “today announced preliminary net income1 of $380.1 million or $0.72 per diluted share for the quarter ended September 30, 2026”
- Diluted EPS: “today announced preliminary net income1 of $380.1 million or $0.72 per diluted share for the quarter ended September 30, 2026”
- Adjusted diluted EPS: “Preliminary adjusted net income2 was $493.4 million and preliminary adjusted diluted earnings per share2 was $0.94 for the quarter ended September 30, 2026”
- Operating income: “Preliminary operating income was $355.8 million for the quarter ended September 30, 2026, as compared to operating income of $215.8 million for the previous quarter and $85.4 million for the prior year.”
- Operating margin: “Operating income | 355.8 | 215.8 | 65% | 85.4 | 317% | 1,175.9 | 604.1 | 95% Operating margin | 14.6% | 9.2% | 3.6% | 12.5% | 6.9%”
- Adjusted operating margin: “Adjusted operating margin | 31.8% | 28.0% | 26.0% | 28.0% | 24.5% Adjusted net income | $493.4 | $386.3 | 28% | $357.5 | 38%”
- Total AUM: “AUM increased 8% year-over-year to $1.8 trillion, and our institutional pipeline of won-but-unfunded mandates remained strong at $22.0 billion.”
- Quarterly long-term net inflows: “We generated $20.8 billion in long-term net inflows during the fourth quarter, bringing full-year long-term net inflows to $84.1 billion”
- Alternative AUM: “Alternative AUM reached $304.6 billion, with $48.7 billion in fundraising, including $43.2 billion in private markets for the fiscal year.”
- ETF AUM: “ETF AUM increasing 73% to $84.6 billion, retail SMA AUM growing 19% to $196.3 billion and Canvas AUM doubling to $32.6 billion.”
- Retail SMA AUM: “retail SMA AUM growing 19% to $196.3 billion and Canvas AUM doubling to $32.6 billion.”
- Canvas AUM: “Canvas® (custom portfolio solutions) AUM increased 100% to $32.6 billion with $2.7 billion of net inflows in the quarter”
- Institutional pipeline (won but unfunded): “our institutional pipeline of won-but-unfunded mandates remained strong at $22.0 billion.”
- Digital assets AUM: “Digital assets AUM more than doubled to $3.6 billion across tokenized money market funds, crypto ETFs, blockchain venture capital and liquidity”
Copied from the press release ↗ and other documents in the SEC filing ↗. A figure is published only if its sentence is in those documents.
| From the filing | Q4 FY2026 | vs year ago | vs last quarter |
|---|---|---|---|
| Revenue | $2.4B | +3.9% | +3.2% |
| Operating income | $355.8M | +316.6% | +64.9% |
| Net income | $380.1M | +223.2% | +121.6% |
| Free cash flow | $532.7M | — | — |
| Operating margin | 14.6% | +11.0 pts | +5.4 pts |
Calculated by code from XBRL, not by the model.
Outlook
| Metric | Period | Outlook |
|---|---|---|
| Adjusted operating margin | fiscal year 2027 | ~30% |
| Adjusted operating expenses excluding performance fee-related expenses | fiscal year 2027 | in line with or slightly above fiscal year 2026 |
Key takeaways
Alternatives is the main growth engine
Alternative AUM reached a record $304.6 billion, with $43.2 billion of private markets fundraising for the year across secondary private equity, alternative credit, real estate and venture. Alternatives net inflows were $9.5 billion in the quarter, making it the largest contributor to flows.
Acquisitions deepen real estate and credit
Clarion announced the Stoneshield Capital acquisition, tripling its European AUM to $13 billion. Apera closed in October 2025 and the Encina Lender Finance deal completed in October 2026, adding European private credit and asset-backed finance. Alternative credit AUM reached a record $100 billion.
New vehicles broaden distribution beyond mutual funds
ETF AUM rose 73% to $84.6 billion with 20 consecutive quarters of net inflows, and active ETFs were over half of ETF net inflows for the year. Retail SMA AUM reached $196.3 billion and Canvas doubled to $32.6 billion.
Wealth channel push for private markets
Evergreen private-markets funds built for wealth management reached $9.7 billion in AUM across Lexington, Benefit Street Partners and Clarion. The company also launched private markets model portfolios with Corastone and an inaugural $1.5 billion collateralized fund obligation.
Digital assets and tokenization are scaling
Digital assets AUM more than doubled to $3.6 billion. The company completed the 250 Digital acquisition, launched the Franklin Crypto division and expanded partnerships with firms including Uber, HSBC and Ondo Finance.
Charts
Fourth quarter worked out from the annual figure.
Data
| Q1 FY25 | $2.3B |
| Q2 FY25 | $2.1B |
| Q3 FY25 | $2.1B |
| Q4 FY25 | $2.3B * |
| Q1 FY26 | $2.3B |
| Q2 FY26 | $2.3B |
| Q3 FY26 | $2.4B |
| Q4 FY26 | $2.4B * |
Data
| Q1 FY25 | $0.29 |
| Q2 FY25 | $0.26 |
| Q3 FY25 | $0.15 |
| Q1 FY26 | $0.46 |
| Q2 FY26 | $0.49 |
| Q3 FY26 | $0.31 |
Fourth-quarter EPS appears once the press release is read; filings report it only for the full year.
Data
| Q1 FY25 | 9.7% |
| Q2 FY25 | 6.9% |
| Q3 FY25 | 7.5% |
| Q4 FY25 | 3.6% |
| Q1 FY26 | 12.1% |
| Q2 FY26 | 14.1% |
| Q3 FY26 | 9.2% |
| Q4 FY26 | 14.6% |
Data
| Q1 FY25 | -$217.0M |
| Q2 FY25 | -$87.6M |
| Q3 FY25 | $1.3B |
| Q4 FY25 | -$51.9M |
| Q4 FY26 | $532.7M |
Operating cash flow minus capital expenditure, from cash flow statements.
Questions
What drove Franklin Templeton's flows in fiscal 2026?
Long-term net inflows were $84.1 billion, positive in every quarter, led by equity, multi-asset and alternatives, across all regions and in both retail and institutional channels. Fixed income was roughly flat for the year, and Western Asset had $11.7 billion of long-term net outflows.
How is Franklin Templeton expanding in private markets?
It fundraised $43.2 billion in private markets in fiscal 2026 and grew alternative AUM to $304.6 billion. It added Apera, announced Stoneshield, completed Encina and built evergreen products for the wealth channel.
Which newer investment vehicles are growing fastest?
ETF AUM rose 73% to $84.6 billion and Canvas AUM doubled to $32.6 billion. Retail SMAs grew 19% to $196.3 billion, with record net inflows in ETFs, retail SMAs, Canvas and private funds.
What is Franklin Templeton doing in digital assets?
Digital assets AUM more than doubled to $3.6 billion across tokenized money market funds, crypto ETFs, blockchain venture capital and liquidity. It launched Franklin Crypto, completed the 250 Digital acquisition and expanded partnerships with Uber, HSBC, Ondo Finance and others.
What is management guiding for fiscal 2027?
It anticipates an adjusted operating margin of about 30%, two years ahead of plan, with expenses in line with or slightly above fiscal 2026. That includes the Stoneshield and Encina acquisitions, and the effective fee rate should be broadly in line with fiscal 2026.
Call recording
Call recording on YouTube ↗. Official replay ↗.