
Franklin Templeton (BEN) · Asset Management
Franklin Templeton Q3 FY2026 earnings: summary, key numbers & outlook
Results filed 31 Jul 2026 · Quarter ended 30 Jun 2026
Slides (25 pages)Press release ↗Investor relations ↗
Summaries and transcripts are machine-generated and can contain errors.
In brief
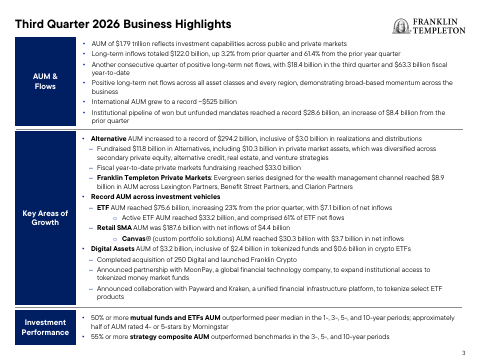
Franklin Templeton posted positive net flows in every asset class and region, led by private markets, where fiscal year-to-date fundraising of $33.0 billion already exceeded its full-year target.
Clients are buying public and private strategies from the same firm. Alternatives fundraising spanned secondary private equity, alternative credit, real estate and venture, while ETFs, retail separately managed accounts and the Canvas custom portfolio platform kept drawing inflows. Institutions are committing too: won-but-unfunded mandates reached a record $28.6 billion. International AUM hit a record of about $525 billion, and Franklin Crypto launched after the 250 Digital acquisition.
Management says investors want integrated solutions across public and private assets, and it plans to keep investing in new capabilities and distribution, including digital assets and tokenized funds. The company will rename itself Franklin Templeton, Inc. on August 17, 2026. The tension is that growth leans on private markets and a few vehicles. Equity and fixed income net flows were small, Western still had net outflows, and fund performance slipped in several periods.
Slides & documents
Open the slide deck (PDF, 25 pages) ↗
Showing the first 6 of 25 pages.
From Franklin Templeton investor relations
SEC filing
Key numbers
- Operating revenues · GAAP
- $2.4B
- Net income attributable to Franklin Resources · GAAP
- $171.5 million
- Diluted EPS · GAAP
- $0.31
- Adjusted diluted EPS · non-GAAP
- $0.72
- Operating income · GAAP
- $215.8 million
- Operating margin · GAAP
- 9.2%
- Adjusted operating margin · non-GAAP
- 28.0%
up 14% from a year ago
up 86% from a year ago
up from $0.15 a year ago
up from $0.49 a year ago
up from $154.1 million a year ago
up from 7.5% a year ago
up from 23.7% a year ago
| Segment or metric | Value | Change |
|---|---|---|
| Ending AUM | $1.8T | up 11% from a year ago |
| Long-term net flows | $18.4 billion | versus net outflows of $9.3 billion a year ago |
| Alternative AUM | $294.2 billion | record; up from $258.4 billion a year ago |
| Institutional won-but-unfunded pipeline | $28.6 billion | up $8.4 billion from the prior quarter |
| ETF AUM | $75.6 billion | up 23% from the prior quarter |
| Retail SMA AUM | $187.6 billion | $4.4 billion of net inflows |
| Canvas AUM | $30.3 billion | $3.7 billion of net inflows |
| Digital assets AUM | $3.2 billion |
Where each number comes from
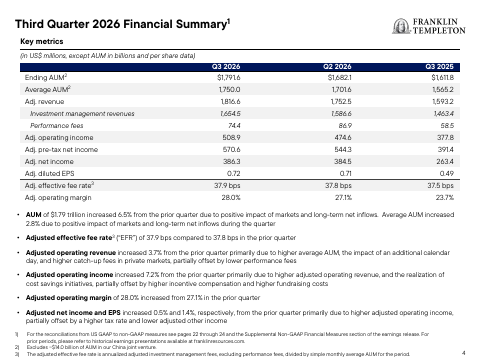
- Operating revenues: “Operating revenues | $2,358.4 | $2,294.9 | 3% | $2,064.0 | 14% Operating income | 215.8 | 323.3 | (33 | %) | 154.1 | 40%”
- Net income attributable to Franklin Resources: “today announced net income1 of $171.5 million or $0.31 per diluted share for the quarter ended June 30, 2026, as compared to $268.2 million”
- Diluted EPS: “today announced net income1 of $171.5 million or $0.31 per diluted share for the quarter ended June 30, 2026, as compared to $268.2 million”
- Adjusted diluted EPS: “Adjusted net income2 was $386.3 million and adjusted diluted earnings per share2 was $0.72 for the quarter ended June 30, 2026”
- Operating income: “Operating income was $215.8 million for the quarter ended June 30, 2026, as compared to $323.3 million for the previous quarter and $154.1 million for the prior year.”
- Operating margin: “Operating income | 215.8 | 323.3 | (33 | %) | 154.1 | 40% Operating margin | 9.2% | 14.1% | 7.5%”
- Adjusted operating margin: “Adjusted operating margin | 28.0% | 27.1% | 23.7% Adjusted net income | $386.3 | $384.5 | 0% | $263.4 | 47%”
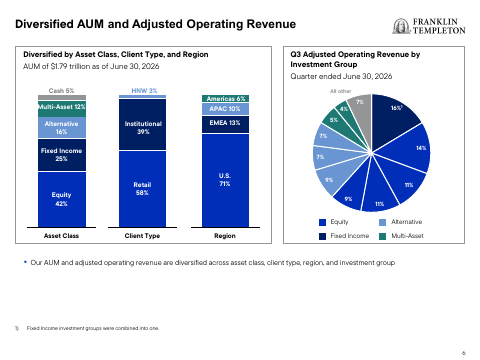
- Ending AUM: “Ending | $1,791.6 | $1,682.1 | 7% | $1,611.8 | 11% Average3 | 1,750.0 | 1,701.6 | 3% | 1,565.2 | 12% Long-term net flows | 18.4 | 16.9”
- Long-term net flows: “We delivered $18.4 billion in long-term net inflows across public and private assets, bringing fiscal year-to-date long-term net inflows to $63.3 billion.”
- Alternative AUM: “Alternative AUM reached a record $294.2 billion as we fundraised $11.8 billion, including $10.3 billion in private market strategies”
- Institutional won-but-unfunded pipeline: “Institutional pipeline of won but unfunded mandates reached a record $28.6 billion, an increase of $8.4 billion from the prior quarter”
- ETF AUM: “ETF AUM reached $75.6 billion, increasing 23% from the prior quarter, with $7.1 billion of net inflows”
- Retail SMA AUM: “Retail SMA AUM was $187.6 billion with net inflows of $4.4 billion”
- Canvas AUM: “Canvas® (custom portfolio solutions) AUM reached $30.3 billion with $3.7 billion in net inflows”
- Digital assets AUM: “Digital Assets AUM of $3.2 billion, inclusive of $2.4 billion in tokenized funds and $0.6 billion in crypto ETFs”
Copied from the press release ↗ and other documents in the SEC filing ↗. A figure is published only if its sentence is in those documents.
| From the filing | Q3 FY2026 | vs year ago | vs last quarter |
|---|---|---|---|
| Revenue | $2.4B | +14.3% | +2.8% |
| Operating income | $215.8M | +40.0% | −33.3% |
| Net income | $171.5M | +85.8% | −36.1% |
| Diluted EPS | $0.31 | +106.7% | −36.7% |
| Operating margin | 9.2% | +1.7 pts | −4.9 pts |
Calculated by code from XBRL, not by the model.
Outlook
| Metric | Period | Outlook |
|---|---|---|
| Adjusted operating expenses vs. fiscal year 2025 | fiscal year 2026 | slightly higher than fiscal year 2025 |
Key takeaways
Private markets fundraising beat the full-year target early
Franklin raised $10.3 billion in private market strategies this quarter, bringing the fiscal year-to-date total to $33.0 billion, above its target with one quarter left. Fundraising spanned secondary private equity, alternative credit, real estate and venture.
Wealth channel evergreen private funds are scaling
The Franklin Templeton Private Markets evergreen series, built for wealth managers, reached $8.9 billion in AUM across Lexington Partners, Benefit Street Partners and Clarion Partners. It opens private assets to a broader client base.
Vehicle growth: active ETFs, SMAs and Canvas
ETF AUM reached $75.6 billion, and active ETFs made up 61% of ETF net flows. Retail SMAs and Canvas also took in net inflows of $4.4 billion and $3.7 billion.
Digital assets build-out gains partners and a brand
Franklin completed the 250 Digital acquisition and launched Franklin Crypto. It also announced a MoonPay partnership for tokenized money market funds and a Payward and Kraken collaboration to tokenize select ETF products.
Record institutional pipeline, but core flows are thin
Won-but-unfunded mandates hit a record $28.6 billion, and net flows were positive in every asset class and region. Equity and fixed income net inflows were only $2.0 billion and $2.6 billion, and Western had $1.1 billion of net outflows.
Charts
Fourth quarter worked out from the annual figure.
Data
| Q1 FY25 | $2.3B |
| Q2 FY25 | $2.1B |
| Q3 FY25 | $2.1B |
| Q4 FY25 | $2.3B * |
| Q1 FY26 | $2.3B |
| Q2 FY26 | $2.3B |
| Q3 FY26 | $2.4B |
| Q4 FY26 | $2.4B * |
Data
| Q1 FY25 | $0.29 |
| Q2 FY25 | $0.26 |
| Q3 FY25 | $0.15 |
| Q1 FY26 | $0.46 |
| Q2 FY26 | $0.49 |
| Q3 FY26 | $0.31 |
Fourth-quarter EPS appears once the press release is read; filings report it only for the full year.
Data
| Q1 FY25 | 9.7% |
| Q2 FY25 | 6.9% |
| Q3 FY25 | 7.5% |
| Q4 FY25 | 3.6% |
| Q1 FY26 | 12.1% |
| Q2 FY26 | 14.1% |
| Q3 FY26 | 9.2% |
| Q4 FY26 | 14.6% |
Data
| Q1 FY25 | -$217.0M |
| Q2 FY25 | -$87.6M |
| Q3 FY25 | $1.3B |
| Q4 FY25 | -$51.9M |
| Q4 FY26 | $532.7M |
Operating cash flow minus capital expenditure, from cash flow statements.
Questions
What drove Franklin Templeton's growth this quarter?
Long-term net inflows were positive across every asset class and region, led by alternatives and multi-asset. Demand was strong in ETFs, retail SMAs and Canvas, and the institutional won-but-unfunded pipeline reached a record $28.6 billion.
How is Franklin Templeton doing in private markets?
It fundraised $10.3 billion in private market strategies, bringing fiscal year-to-date fundraising to $33.0 billion, above its fiscal-year target. Alternative AUM hit a record $294.2 billion.
What is Franklin Templeton doing in digital assets?
It completed the acquisition of 250 Digital, launched Franklin Crypto, and now has $3.2 billion in digital assets AUM, including $2.4 billion in tokenized funds. It also announced partnerships with MoonPay and with Payward and Kraken.
Is Franklin Templeton changing its corporate name?
Yes. Franklin Resources, Inc. will become Franklin Templeton, Inc. effective August 17, 2026. It is a name change only, and the stock will keep trading on the NYSE as BEN.
What are the main risks to Franklin Templeton's strategy?
Equity and fixed income net inflows were small, Western had net outflows, and cash management had net outflows of $7.0 billion. The firm also reported that fund performance versus peers declined in some periods, driven partly by one large yield-focused fund.