
Ameriprise Financial (AMP) · Asset Management
Ameriprise Financial Q3 2026 earnings: summary, key numbers & outlook
Results filed 29 Oct 2026 · Quarter ended 30 Sep 2026
Slides (19 pages)Press release ↗Investor relations ↗
Summaries and transcripts are machine-generated and can contain errors.
In brief
Ameriprise completed the Huntington Bank advisor transition, bringing 258 advisors and $28 billion of client assets onto its platform as it deepens its financial institutions channel.
Ameriprise's advice business kept attracting assets and advisors. It added 79 experienced advisors, and revenue per advisor reached a new high of $1.2 million. Wrap assets, which are fee-based advisory accounts, grew 12 percent to $729 billion. Retirement and Protection sales rose 24 percent on demand for structured variable annuities. Asset management was weaker on flows, with net outflows of $9.3 billion, as active managers face industry pressure and institutional clients changed their asset allocations.
Management says it will keep investing in the client and advisor experience, including integrating AI, and will lean on financial institution partnerships such as Huntington for growth. It also expects about $32 billion of Huntington assets to move over through mid-2027. The main tension is that the advice business is gaining while Columbia Threadneedle still loses assets, and growth in advisors and platform assets now relies more on partner transitions.
Slides & documents
Open the slide deck (PDF, 19 pages) ↗

Showing the first 6 of 19 pages.
From Ameriprise Financial investor relations
- WebcastWebcast replay ↗
- RiverSource Life Insurance Company QuarterlyDocument ↗
- RiverSource Life Insurance Company NY QuarterlyDocument ↗
- Ameriprise Certificate Company SEC QuarterlyDocument ↗
- Ameriprise Bank FSB Call ReportDocument ↗
- 10-QDocument ↗
SEC filing
Key numbers
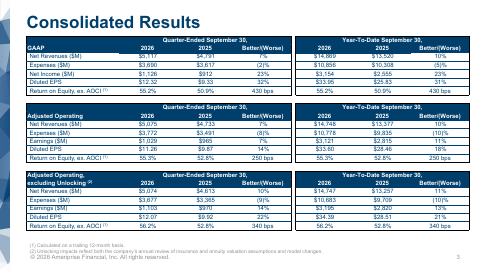
- Adjusted operating net revenues · non-GAAP
- $5.1 billion
- GAAP net income per diluted share · GAAP
- $12.32
- Adjusted operating earnings per diluted share · non-GAAP
- $11.26
- Pretax adjusted operating margin · non-GAAP
- 28 percent
- Return on equity, ex AOCI · non-GAAP
- 56 percent
up 10%
compared to $9.33 a year ago
up 14%
| Segment or metric | Value | Change |
|---|---|---|
| Total assets under management, administration and advisement | $1.8 trillion | up 8 percent |
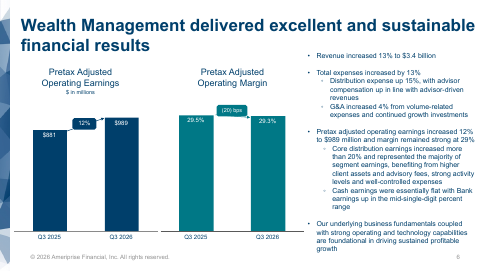
| Advice & Wealth Management net revenues | $3.4B | up 13% |
| Wrap assets | $729 billion | up 12 percent |
| Adjusted operating net revenue per advisor (TTM) | $1.2 million | up 13 percent |
| Asset Management AUM and advisement | $743 billion | up 4 percent |
| Asset Management net outflows | $9.3 billion | |
| Retirement & Protection Solutions sales | $1.8 billion | up 24 percent |
Where each number comes from
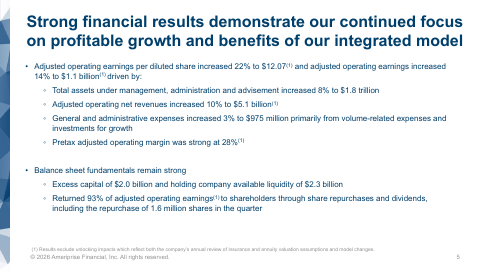
- Adjusted operating net revenues: “Adjusted operating net revenues increased 10 percent to $5.1 billion(2) primarily from asset growth and strong client engagement.”
- GAAP net income per diluted share: “Third quarter GAAP net income per diluted share was $12.32 compared to $9.33 a year ago, driven by continued asset growth”
- Adjusted operating earnings per diluted share: “Third quarter adjusted operating earnings per diluted share increased 14 percent to $11.26.”
- Pretax adjusted operating margin: “Pretax adjusted operating margin was strong at 28 percent(2).”
- Return on equity, ex AOCI: “Return on equity remains distinguished in the industry at 56 percent(1)(2).”
- Total assets under management, administration and advisement: “Assets under management, administration and advisement grew to $1.8 trillion, up 8 percent.”
- Advice & Wealth Management net revenues: “Adjusted operating net revenues | $3,371 | $2,990 | 13% Distribution expenses | 1,911 | 1,656”
- Wrap assets: “wrap assets were $729 billion, up $79 billion, or 12 percent, driven by organic growth and market appreciation”
- Adjusted operating net revenue per advisor (TTM): “Adjusted operating net revenue per advisor on a trailing 12-month basis reached a new high of $1.2 million, up 13 percent.”
- Asset Management AUM and advisement: “Assets under management and advisement increased 4 percent to $743 billion.”
- Asset Management net outflows: “In the quarter, net outflows were $9.3 billion, reflecting:”
- Retirement & Protection Solutions sales: “Retirement & Protection Solutions sales increased 24 percent to $1.8 billion, with continued strong client demand”
Copied from the press release ↗ and other documents in the SEC filing ↗. A figure is published only if its sentence is in those documents.
| From the filing | Q3 2026 | vs year ago | vs last quarter |
|---|---|---|---|
| Revenue | $5.2B | +6.1% | +3.6% |
| Net income | $1.1B | +23.5% | +1.2% |
| Diluted EPS | $12.32 | +32.0% | +2.8% |
| Free cash flow | $1.4B | −33.8% | −49.8% |
Calculated by code from XBRL, not by the model.
Outlook
| Metric | Period | Outlook |
|---|---|---|
| Operating effective tax rate | full year 2026 | 20 to 22 percent |
| Huntington assets transitioning to Ameriprise platform | through mid-2027 | approximately $32 billion |
Key takeaways
Huntington transition expands the financial institutions channel
258 Huntington advisors have moved to Ameriprise, with $28 billion of client assets transferring through early 2027. Another 29 advisors with nearly $4 billion from Huntington's Cadence Bank acquisition join in mid-2027.
Advisor productivity hit a new high
Revenue per advisor reached $1.2 million on a trailing 12-month basis, and 79 experienced advisors were added. Advisor retention remains strong and same-store sales stayed in the 4% range.
Asset Management flows remain under pressure
Net outflows were $9.3 billion, including $5.5 billion institutional on client asset allocation decisions and $2.9 billion retail. Management cites industry pressure on active managers.
Strategic product areas are drawing inflows
Technology and healthcare strategies took in $1.3 billion, and ETFs, SMAs and Model Delivery took in $2.4 billion. This supports the push into broader product structures and alternatives.
Annuity demand supports planning-led model
Retirement & Protection sales rose 24% to $1.8 billion, led by structured variable annuities, variable annuities without living benefit riders and variable universal life. These products serve wealth management planning clients.
Charts
Fourth quarter worked out from the annual figure.
Data
| Q4 2024 | $4.6B * |
| Q1 2025 | $4.5B |
| Q2 2025 | $4.5B |
| Q3 2025 | $4.9B |
| Q4 2025 | $5.0B * |
| Q1 2026 | $4.9B |
| Q2 2026 | $5.0B |
| Q3 2026 | $5.2B |
Data
| Q1 2025 | $5.83 |
| Q2 2025 | $10.73 |
| Q3 2025 | $9.33 |
| Q1 2026 | $9.68 |
| Q2 2026 | $11.98 |
| Q3 2026 | $12.32 |
Fourth-quarter EPS appears once the press release is read; filings report it only for the full year.
Data
| Q4 2024 | $325.0M |
| Q1 2025 | $1.6B |
| Q2 2025 | $1.7B |
| Q3 2025 | $2.2B |
| Q4 2025 | $2.6B |
| Q1 2026 | $430.0M |
| Q2 2026 | $2.8B |
| Q3 2026 | $1.4B |
Operating cash flow minus capital expenditure, from cash flow statements.
Questions
What happened with the Huntington Bank partnership?
Ameriprise and Huntington completed the transition of 258 Huntington advisors, with $28 billion of client assets transferring through early 2027. A further 29 advisors with nearly $4 billion from Huntington's Cadence Bank acquisition join in mid-2027.
How is Ameriprise using AI?
The CEO said Ameriprise is investing in the client and advisor experience, including thoughtfully integrating AI. He credits this with high engagement, practice growth and strong client activity, but the sources give no specific AI products.
Why did Asset Management have net outflows?
Net outflows were $9.3 billion. Institutional outflows of $5.5 billion reflected client asset allocation decisions, while retail outflows of $2.9 billion included about $0.8 billion from VP/VIT funds and industry pressure on active managers.
Where is Asset Management seeing inflows?
Net inflows reached $1.3 billion in technology and healthcare strategies and $2.4 billion in ETFs, SMAs and Model Delivery offerings. Management is also expanding alternative strategies.
What is driving demand in Advice & Wealth Management?
Wrap net inflows, annuity sales and brokerage transactions are driving it. Excluding Comerica, client net inflows rose 56% to $5.3 billion and wrap net inflows rose 38% to $6.6 billion.
Call recording
Call recording on YouTube ↗. Official replay ↗.