
Ameriprise Financial (AMP) · Asset Management
Ameriprise Financial Q2 2026 earnings: summary, key numbers & outlook
Results filed 23 Jul 2026 · Quarter ended 30 Jun 2026
Slides (19 pages)Press release ↗Investor relations ↗
Summaries and transcripts are machine-generated and can contain errors.
In brief
Ameriprise is putting advanced AI into advisor workflows and adding $28 billion of Huntington Bank assets, which more than offsets Comerica advisor departures.
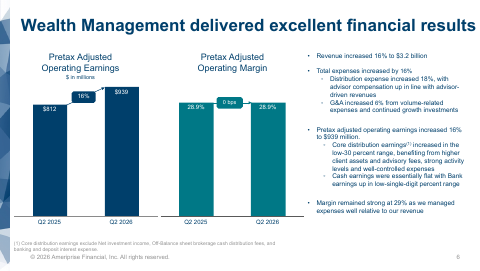
Advice & Wealth Management kept growing. Wrap assets rose 19% to $732 billion, 79 experienced advisors were recruited, and revenue per advisor hit a new high of $1.2 million. Client flows were held back by advisor departures, including Comerica terminations. Retirement & Protection Solutions sales rose 20%, led by structured variable annuities and variable universal life. Asset Management still had net outflows, though retail outflows improved on higher gross sales in the U.S. and EMEA.
Management is steering toward more AI in advisor workflows, a growing bank, and the Huntington Bank partnership. The stated goal is to keep human relationships at the center of advice. The main tension is flows. Advisor departures weigh on client flows, and Asset Management institutional outflows continue. Cash balances are also shifting between products as rates change, so the platform has to keep winning new assets to offset them.
Slides & documents
Open the slide deck (PDF, 19 pages) ↗
Showing the first 6 of 19 pages.
From Ameriprise Financial investor relations
- WebcastWebcast replay ↗
- RiverSource Life Insurance Company QuarterlyDocument ↗
- RiverSource Life Insurance Company NY QuarterlyDocument ↗
- Ameriprise Certificate Company SEC QuarterlyDocument ↗
- Ameriprise Bank FSB Call ReportDocument ↗
- 10-QDocument ↗
SEC filing
Key numbers
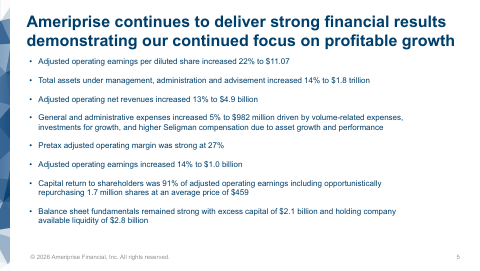
- Adjusted operating net revenues · non-GAAP
- $4.9 billion
- GAAP net income per diluted share · GAAP
- $11.98
- Adjusted operating EPS · non-GAAP
- $11.07
- Adjusted operating earnings · non-GAAP
- $1.0B
- Pretax adjusted operating margin · non-GAAP
- 27 percent
- Adjusted operating return on equity, ex. AOCI · non-GAAP
- 55 percent
up 13%
up from $10.73 a year ago
up 22%
up 14% from $900 a year ago
| Segment or metric | Value | Change |
|---|---|---|
| Total assets under management, administration and advisement | $1.8 trillion | up 14 percent |
| Advice & Wealth Management total client assets | $1.2T | up 15% |
| Wrap assets | $732.0B | up 19% |
| Wrap net flows | $6.9B | up 28% |
| Revenue per advisor (TTM) | $1.2 million | up 12 percent |
| Asset Management assets under management and advisement | $759.0B | up 10% |
| Asset Management total net outflows | -$6.5B | improved 26% |
| Retirement & Protection Solutions sales | $1.6 billion | up 20 percent |
Where each number comes from
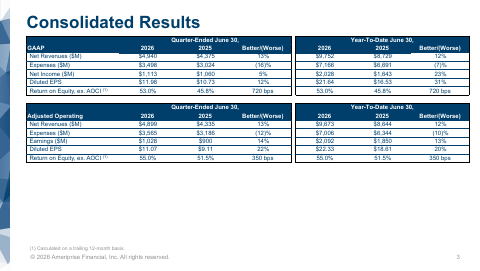
- Adjusted operating net revenues: “Adjusted operating net revenues increased 13 percent to $4.9 billion primarily from asset growth and strong client engagement.”
- GAAP net income per diluted share: “Second quarter GAAP net income per diluted share was $11.98 compared to $10.73 a year ago, driven by continued asset growth”
- Adjusted operating EPS: “Second quarter adjusted operating earnings per diluted share increased 22 percent to $11.07, reflecting continued asset growth.”
- Adjusted operating earnings: “Adjusted operating earnings (see reconciliation on p. 24 & 25) | $1,028 | $900 | 14% | $2,092 | $1,850 | 13%”
- Pretax adjusted operating margin: “Pretax adjusted operating margin was strong at 27 percent. •Balance sheet fundamentals continued to be a core differentiator.”
- Adjusted operating return on equity, ex. AOCI: “Return on equity remains distinguished in the industry at 55 percent(1).”
- Total assets under management, administration and advisement: “Assets under management, administration and advisement grew to a record $1.8 trillion, up 14 percent.”
- Advice & Wealth Management total client assets: “Total client assets | $1,248 | $1,084 | 15% Total client net flows | $3.1 | $4.3 | (28)% Wrap assets | $732 | $615 | 19%”
- Wrap assets: “wrap assets increased $116 billion, or 19 percent, to $732 billion driven by organic growth and market appreciation.”
- Wrap net flows: “Wrap net flows | $6.9 | $5.4 | 28% Cash sweep balances | $28.8 | $27.4 | 5%”
- Revenue per advisor (TTM): “Adjusted operating net revenue per advisor on a trailing 12-month basis reached a new high of $1.2 million, up 12 percent.”
- Asset Management assets under management and advisement: “Assets Under Management and Advisement (2) | $759 | $690 | 10% Net Flows Global Retail net AUM flows”
- Asset Management total net outflows: “Total Net AUM and AUA flows (2) | $(6.5) | $(8.7) | 26% (1) See reconciliation on page 13.”
- Retirement & Protection Solutions sales: “Retirement & Protection Solutions sales increased 20 percent to $1.6 billion, with continued strong client demand for structured variable annuities”
Copied from the press release ↗ and other documents in the SEC filing ↗. A figure is published only if its sentence is in those documents.
| From the filing | Q2 2026 | vs year ago | vs last quarter |
|---|---|---|---|
| Revenue | $5.0B | +11.6% | +2.6% |
| Net income | $1.1B | +5.0% | +21.6% |
| Diluted EPS | $11.98 | +11.6% | +23.8% |
| Free cash flow | $2.8B | +65.1% | +562.6% |
Calculated by code from XBRL, not by the model.
Outlook
| Metric | Period | Outlook |
|---|---|---|
| Operating effective tax rate | full year 2026 | 20 to 22 percent |
Key takeaways
AI is moving into advisor workflows
Ameriprise says it is accelerating AI adoption across the firm, including advanced AI capabilities in advisors' workflows, while keeping human relationships at the center of advice. Advice & Wealth Management spending on AI transformation and automation is also adding to its general and administrative costs.
Huntington partnership offsets Comerica departures
Client flows were reduced by advisor departures, including Comerica terminations. Management says the Huntington Bank partnership will bring $28 billion of assets onto the platform, which will more than offset that impact.
Advisor productivity keeps setting records
Trailing-12-month revenue per advisor reached $1.2 million, up 12%, and 79 experienced advisors were recruited. Management cites sustained productivity growth of 10% annually over the past five years.
Annuity and life demand is strong
Retirement & Protection Solutions sales rose 20% to $1.6 billion on demand for structured variable annuities, variable annuities without living benefit riders and variable universal life. Transactional activity in Advice & Wealth Management also rose 13%, helped by annuity sales.
Asset Management outflows narrow but persist
Retail and model delivery net outflows improved to $1.4 billion on higher gross sales in the U.S. and EMEA, while institutional net outflows were $5.1 billion. Strong Seligman technology strategy performance helped, and 97 Columbia Threadneedle funds earned four- or five-star Morningstar ratings.
Charts
Fourth quarter worked out from the annual figure.
Data
| Q4 2024 | $4.6B * |
| Q1 2025 | $4.5B |
| Q2 2025 | $4.5B |
| Q3 2025 | $4.9B |
| Q4 2025 | $5.0B * |
| Q1 2026 | $4.9B |
| Q2 2026 | $5.0B |
| Q3 2026 | $5.2B |
Data
| Q1 2025 | $5.83 |
| Q2 2025 | $10.73 |
| Q3 2025 | $9.33 |
| Q1 2026 | $9.68 |
| Q2 2026 | $11.98 |
| Q3 2026 | $12.32 |
Fourth-quarter EPS appears once the press release is read; filings report it only for the full year.
Data
| Q4 2024 | $325.0M |
| Q1 2025 | $1.6B |
| Q2 2025 | $1.7B |
| Q3 2025 | $2.2B |
| Q4 2025 | $2.6B |
| Q1 2026 | $430.0M |
| Q2 2026 | $2.8B |
| Q3 2026 | $1.4B |
Operating cash flow minus capital expenditure, from cash flow statements.
Questions
What is Ameriprise doing with AI?
Ameriprise says it is accelerating AI adoption across the firm and bringing advanced AI capabilities into advisors' workflows. It also says human engagement and relationships stay at the center of advice.
How is Ameriprise handling the Comerica advisor departures?
Comerica terminations and other advisor departures reduced client flows this quarter. Management says the partnership with Huntington Bank will bring $28 billion of assets onto the platform, more than offsetting the Comerica impact.
What is happening with client cash and the bank?
Cash sweep balances rose 5% to $28.8 billion, and bank assets rose 6% to $25.5 billion. Management expects the bank to be a growing source of earnings, while certificate balances fell to $7.4 billion as clients shifted to other products.
Where is demand strongest in Retirement & Protection Solutions?
Sales rose 20% to $1.6 billion. Demand was strongest for structured variable annuities, variable annuities without living benefit riders and variable universal life insurance.
How is the Asset Management business doing on flows and performance?
Net outflows improved to $6.5 billion, with retail outflows narrowing on higher gross sales in the U.S. and EMEA, though institutional outflows continued at $5.1 billion. 69% of retail funds were above median over one year and 87% over ten years, and Seligman technology strategies performed strongly.