
Agilent (A) · Life Sciences
Agilent Q2 FY2026 earnings: summary, key numbers & outlook
Results filed 27 May 2026 · Quarter ended 30 Apr 2026
Slides (11 pages)Press release ↗Investor relations ↗
Summaries and transcripts are machine-generated and can contain errors.
In brief
Agilent launched its 9500 ICP-MS platform and said replacement-cycle demand and its Ignite Operating System drove broad-based strength across pharma, diagnostics, chemicals and forensics.
Demand was broad. Instruments grew at a high-single-digit rate, led by low-double-digit growth in liquid chromatography and LC/MS as customers replaced older equipment. Pharma had its fifth straight quarter of mid-single to low-double-digit growth, Cancer Diagnostics grew double digits, and semiconductor demand lifted chemicals. Forensics won share and a TSA airport security contract. Agilent also launched the 9500 ICP-MS platform and announced the Biocare acquisition in March.
Management is steering toward replacement cycles, innovation and the Ignite Operating System, which it credits for pricing gains and efficiencies. It raised its full-year outlook and expects momentum to continue into the third quarter. The tensions are in academia and government, where funding still weighs on instrument spending. China is also a tough comparison against last year's pre-tariff consumables stocking, and funding delays in China and India hurt Food.
No call transcript for this quarter, so this summary also draws on: The Motley Fool ↗.
Slides & documents
Open the slide deck (PDF, 11 pages) ↗

Showing the first 6 of 11 pages.
From Agilent investor relations
SEC filing
Key numbers
- Revenue · GAAP
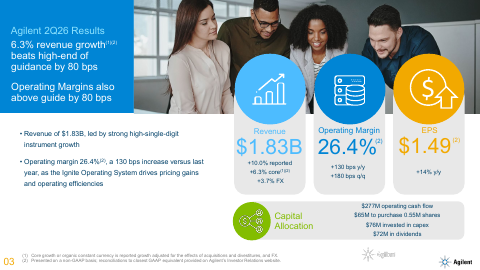
- $1.83 billion
- GAAP net income · GAAP
- $339 million
- GAAP diluted EPS · GAAP
- $1.20
- Non-GAAP EPS · non-GAAP
- $1.49
- Non-GAAP operating margin · non-GAAP
- 26.4%
up 10.0% reported and 6.3% core from a year ago
up 60% from a year ago
up 14% from a year ago
expanded by 130 basis points year-over-year
| Segment or metric | Value | Change |
|---|---|---|
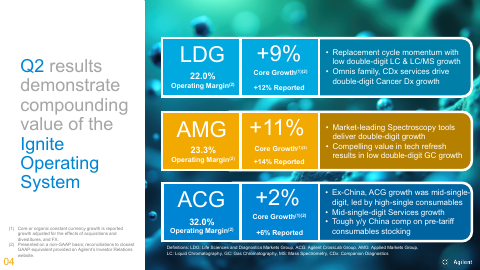
| Life Sciences and Diagnostics Markets Group | $732 million | growth of 12% reported and 9% core |
| Agilent CrossLab Group | $759 million | growth of 6% reported and 2% core |
| Applied Markets Group | $344 million | growth of 14% reported and 11% core |
Where each number comes from
- Revenue: “Revenue of $1.83 billion for the second quarter ended April 30, 2026, representing growth of 10.0% reported and up 6.3% core(1) compared with the second quarter of 2025.”
- GAAP net income: “GAAP net income of $339 million; earnings per share (EPS) of $1.20, an increase of 60% from the second quarter of 2025.”
- GAAP diluted EPS: “GAAP net income of $339 million; earnings per share (EPS) of $1.20, an increase of 60% from the second quarter of 2025.”
- Non-GAAP EPS: “Non-GAAP net income(3) of $423 million; non-GAAP EPS(3) of $1.49, an increase of 14% from the second quarter of 2025.”
- Non-GAAP operating margin: “non-GAAP operating margin(2) of 26.4% expanded by 130 basis points year-over-year and 180 basis points sequentially.”
- Life Sciences and Diagnostics Markets Group: “reported second-quarter revenue of $732 million, growth of 12% reported and 9% core(1) year-over-year.”
- Agilent CrossLab Group: “reported second-quarter revenue of $759 million, growth of 6% reported and 2% core(1) year-over-year.”
- Applied Markets Group: “reported second-quarter revenue of $344 million, growth of 14% reported and 11% core(1) year-over-year.”
Copied from the press release ↗ and other documents in the SEC filing ↗. A figure is published only if its sentence is in those documents.
| From the filing | Q2 FY2026 | vs year ago | vs last quarter |
|---|---|---|---|
| Revenue | $1.8B | +10.0% | +2.1% |
| Operating income | $399.0M | +33.0% | +13.0% |
| Net income | $339.0M | +57.7% | +11.1% |
| Diluted EPS | $1.20 | +60.0% | +12.1% |
| Free cash flow | $201.0M | +87.9% | +14.9% |
| Operating margin | 21.7% | +3.7 pts | +2.1 pts |
Calculated by code from XBRL, not by the model.
Outlook
| Metric | Period | Outlook |
|---|---|---|
| Q3 revenue | fiscal third-quarter 2026 | $1.83 billion to $1.85 billion |
| Q3 non-GAAP EPS | fiscal third-quarter 2026 | $1.48 to $1.50 |
| FY26 revenue | fiscal year 2026 | $7.39 billion to $7.49 billion |
| FY26 non-GAAP EPS | fiscal year 2026 | $6.00 to $6.10 |
Key takeaways
Replacement cycle is driving instrument demand
Liquid chromatography and LC/MS grew at a low-double-digit rate in the Life Sciences and Diagnostics Markets Group, and Gas Chromatography grew at a low double-digit rate in Applied Markets. Management cites tech refresh and replacement-cycle momentum as a core growth driver.
Agilent launched the 9500 ICP-MS platform
The CEO pointed to the new 9500 ICP-MS as proof that Agilent can anticipate customer needs and improve laboratory productivity. New launches were also set to be shown at ASMS the following week.
Cancer Diagnostics and Omnis drive clinical growth
Diagnostics and Clinical grew 11%, driven by expanding Cancer Diagnostics offerings and traction for the Omnis family. Companion diagnostics services also grew at a double-digit rate.
Ignite is delivering pricing gains and efficiencies
Agilent says its Ignite Operating System drives pricing gains and operating efficiencies. A strategic pricing capability delivered roughly 200 basis points of pricing in the quarter.
Academia, China and Food remain soft spots
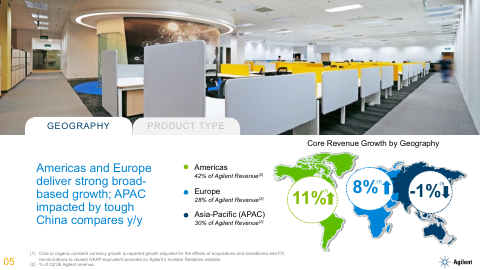
Academia and Government fell 5% on muted research funding, and Food fell 3% on funding delays in China and India. Services and consumables outside China grew at a mid-single-digit rate, but a tough comparison on pre-tariff stocking held China back.
Charts
Fourth quarter worked out from the annual figure.
Data
| Q4 FY24 | $1.7B * |
| Q1 FY25 | $1.7B |
| Q2 FY25 | $1.7B |
| Q3 FY25 | $1.7B |
| Q4 FY25 | $1.9B * |
| Q1 FY26 | $1.8B |
| Q2 FY26 | $1.8B |
| Q3 FY26 | $1.9B |
Data
| Q1 FY25 | $1.11 |
| Q2 FY25 | $0.75 |
| Q3 FY25 | $1.18 |
| Q1 FY26 | $1.07 |
| Q2 FY26 | $1.20 |
| Q3 FY26 | $1.28 |
Fourth-quarter EPS appears once the press release is read; filings report it only for the full year.
Data
| Q4 FY24 | 24.0% |
| Q1 FY25 | 22.4% |
| Q2 FY25 | 18.0% |
| Q3 FY25 | 20.7% |
| Q4 FY25 | 23.8% |
| Q1 FY26 | 19.6% |
| Q2 FY26 | 21.7% |
| Q3 FY26 | 23.6% |
Data
| Q4 FY24 | $388.0M |
| Q1 FY25 | $334.0M |
| Q2 FY25 | $107.0M |
| Q3 FY25 | $259.0M |
| Q4 FY25 | $452.0M |
| Q1 FY26 | $175.0M |
| Q2 FY26 | $201.0M |
| Q3 FY26 | $439.0M |
Operating cash flow minus capital expenditure, from cash flow statements.
Questions
What new product did Agilent highlight this quarter?
The new 9500 ICP-MS platform. The CEO said it shows Agilent can anticipate customer needs and improve laboratory productivity. More launches were slated for ASMS the following week.
Where is Agilent's demand strongest?
Pharma (including biotech), Diagnostics and Clinical, Chemicals and Advanced Materials, and Environmental and Forensics all grew. Semiconductor demand, Cancer Diagnostics and a TSA airport security contract were cited as drivers.
What role does the replacement cycle play?
Management says replacement-cycle and tech-refresh momentum is lifting instruments, including low-double-digit growth in LC and LC/MS and in GC.
Which areas are weak or uncertain?
Academia and Government fell 5% on muted funding. Food fell 3% on funding delays in China and India, and China faced a tough comparison against last year's pre-tariff consumables stocking.
Did Agilent make acquisitions or change its outlook?
It announced the Biocare acquisition in March. It also raised its fiscal 2026 revenue growth, margin expansion and EPS guidance, citing increased confidence in execution.