
Walmart (WMT) · Retail
Walmart Q1 FY2027 earnings: summary, key numbers & outlook
Results filed 21 May 2026 · Quarter ended 30 Apr 2026
Slides (36 pages)Official transcript (PDF) ↗Press release ↗Investor relations ↗
Summaries and transcripts are machine-generated and can contain errors.
In brief
Walmart's first-quarter revenue was $177.8 billion, up 7.3%, with GAAP EPS of $0.67, adjusted EPS of $0.66, and operating income up 5.0%.
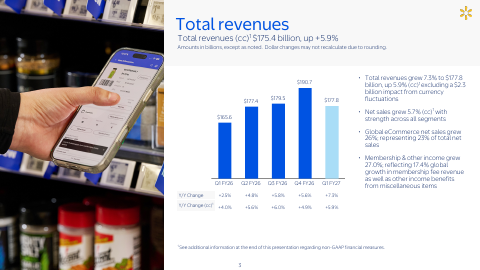
Walmart grew total revenue 7.3% to $177.8 billion, or 5.9% in constant currency. Global eCommerce sales rose 26% and global advertising rose 37%. Operating income rose 5.0% to $7,493 million, held back by about 250 bps of higher fuel costs in distribution and fulfillment. GAAP EPS was $0.67 and adjusted EPS was $0.66. Free cash flow was negative $1.9 billion because capital spending rose and inventory receipts were timed earlier.
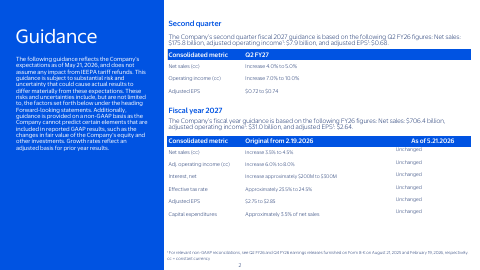
For the second quarter, Walmart expects net sales to grow 4% to 5% in constant currency and adjusted EPS of $0.72 to $0.74. Its fiscal 2027 outlook is unchanged, including adjusted EPS of $2.75 to $2.85. The main tension is that fuel costs, depreciation and healthcare costs are growing expenses faster than sales. Inventory is also up 8.9%, and the guidance assumes no benefit from IEEPA tariff refunds.
Slides & documents
Open the slide deck (PDF, 36 pages) ↗

Showing the first 6 of 36 pages.
From Walmart investor relations
- Transcript - Management Call PDFCompany's official transcript ↗
- Transcript - Buy Side Follow Up Call PDFCompany's official transcript ↗
- Earnings Terminology PDFDocument ↗
- 13-Week Comparable Sales PDFDocument ↗
- Unit Count & Square Footage PDFDocument ↗
SEC filing
Key numbers
- Total revenues · GAAP
- $177.8 billion
- Diluted EPS · GAAP
- $0.67
- Adjusted EPS · non-GAAP
- $0.66
- Operating income · GAAP
- $7.5B
- Operating income as a percent of net sales · GAAP
- 4.3%
- Gross profit rate · GAAP
- 24.3%
- Operating cash flow · GAAP
- $4.7 billion
- Free cash flow · non-GAAP
- negative $1.9 billion
up 7.3%, or 5.9% in constant currency
up 19.6% from a year ago
up 8.2% from a year ago
up 5.0% from a year ago
down from 4.4% a year ago
up 6 bps
a decrease of $0.7 billion
a decrease of $2.4 billion
| Segment or metric | Value | Change |
|---|---|---|
| Walmart U.S. net sales | $117.2 billion | +4.5% |
| Walmart International net sales (cc) | $32.8 billion | +10.1% |
| Sam's Club U.S. net sales | $23.4 billion | +6.1% |
| Global eCommerce sales | 26% | growth; 23% of total net sales |
| Global advertising business | 37% | growth, with Walmart U.S. advertising up 36% |
| Global membership fee revenue | 17.4% | growth |
| Walmart U.S. comp sales (ex. fuel) | 4.1% | vs. 4.5% a year ago |
Where each number comes from
- Total revenues: “Revenue of $177.8 billion, up 7.3%, or 5.9% (cc)1•Global eCommerce sales grew 26%, led by store-fulfilled pickup & delivery and marketplace”
- Diluted EPS: “•GAAP EPS of $0.67; Adjusted EPS1 of $0.66•Company issues guidance for Q2; reiterates outlook for FY27”
- Adjusted EPS: “•GAAP EPS of $0.67; Adjusted EPS1 of $0.66•Company issues guidance for Q2; reiterates outlook for FY27”
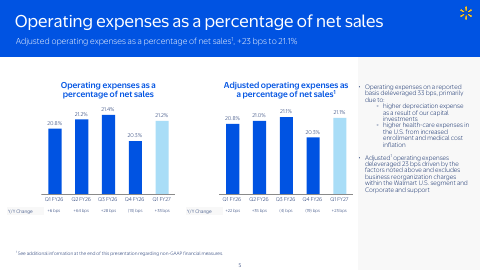
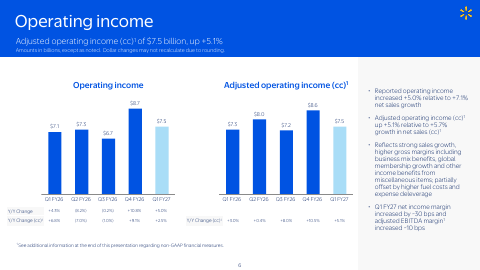
- Operating income: “Operating expenses3 | 37,200 | 21.2% | 34,171 | 20.8% | 8.9% Operating income | $7,493 | 4.3% | $7,135 | 4.4% | 5.0%”
- Operating income as a percent of net sales: “Operating expenses3 | 37,200 | 21.2% | 34,171 | 20.8% | 8.9% Operating income | $7,493 | 4.3% | $7,135 | 4.4% | 5.0%”
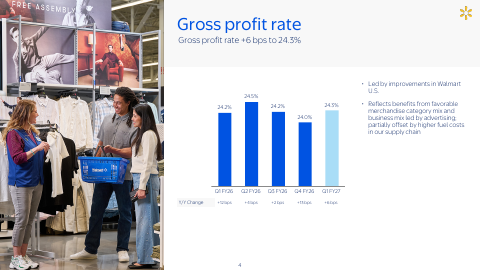
- Gross profit rate: “Gross profit rate +6 bps to 24.3% 4 Adjusted operating expenses as a percentage of net sales1, +23 bps to 21.1%”
- Operating cash flow: “•Operating cash flow of $4.7 billion, a decrease of $0.7 billion •Free cash flow1 of negative $1.9 billion, a decrease of $2.4 billion”
- Free cash flow: “•Operating cash flow of $4.7 billion, a decrease of $0.7 billion •Free cash flow1 of negative $1.9 billion, a decrease of $2.4 billion”
- Walmart U.S. net sales: “Net sales $117.2 billion, +4.5%; eCommerce +26% • Strong growth in grocery and general merchandise categories; partially offset by 100 bps headwind from maximum fair pricing legislation in pharmacy”
- Walmart International net sales (cc): “Net sales (cc)1 $32.8 billion, +10.1% Amounts in billions, except as noted. Dollar changes may not recalculate due to rounding.”
- Sam's Club U.S. net sales: “Net sales $23.4 billion, +6.1%, Net sales without fuel +3.9%, eCommerce +23% • Sales growth led by grocery and general merchandise”
- Global eCommerce sales: “Global eCommerce net sales grew 26%; representing 23% of total net sales”
- Global advertising business: “Global advertising business3 up 37%, with strength across segments. Walmart U.S. advertising up 36%”
- Global membership fee revenue: “Membership fee revenue grew 17.4% globally•Gross profit rate up 6 bps, led by Walmart U.S.”
- Walmart U.S. comp sales (ex. fuel): “Walmart U.S. comp sales2 grew 4.1%. Operating income up 5.0%, negatively affected by 250 bps from higher fuel costs in distribution and fulfillment.”
Copied from the press release ↗ and other documents in the SEC filing ↗. A figure is published only if its sentence is in the filing.
| From the filing | Q1 FY2027 | vs year ago | vs last quarter |
|---|---|---|---|
| Revenue | $177.8B | +7.3% | −6.8% |
| Operating income | $7.5B | +5.0% | −14.0% |
| Net income | $5.3B | +18.8% | +25.8% |
| Diluted EPS | $0.67 | +19.6% | — |
| Free cash flow | -$1.9B | — | — |
| Operating margin | 4.2% | −0.1 pts | −0.4 pts |
Calculated by code from XBRL, not by the model.
Outlook
| Metric | Period | Outlook |
|---|---|---|
| Net sales growth (constant currency) | second quarter of fiscal 2027 | 4.0% to 5.0% |
| Operating income growth (constant currency) | second quarter of fiscal 2027 | 7.0% to 10.0% |
| Adjusted EPS | second quarter of fiscal 2027 | $0.72 to $0.74 |
| Net sales growth (constant currency) | fiscal year 2027 | 3.5% to 4.5% |
| Adjusted operating income growth (constant currency) | fiscal year 2027 | 6.0% to 8.0% |
| Net interest expense increase | fiscal year 2027 | approximately $200M to $300M |
| Effective tax rate | fiscal year 2027 | 23.5% to 24.5% |
| Adjusted EPS | fiscal year 2027 | $2.75 to $2.85 |
| Capital expenditures | fiscal year 2027 | Approximately 3.5% of net sales |
Key takeaways
eCommerce and advertising drove broad growth
Global eCommerce sales grew 26% and the global advertising business grew 37%. Walmart U.S. comp sales grew 4.1%, with transactions up 3.0%.
Fuel costs cut operating income growth
Operating income rose 5.0%, negatively affected by 250 bps from higher fuel costs in distribution and fulfillment. Adjusted operating income rose 5.1% in constant currency.
Free cash flow turned negative on capex
Free cash flow was negative $1.9 billion, a decrease of $2.4 billion. Capital expenditures rose $1.7 billion and operating cash flow fell $0.7 billion.
Second-quarter guidance points to faster profit growth
Walmart expects Q2 net sales to grow 4.0% to 5.0% and operating income to grow 7.0% to 10.0%, both in constant currency. Adjusted EPS is guided to $0.72 to $0.74.
Full-year outlook unchanged despite expense pressure
Adjusted EPS guidance stays at $2.75 to $2.85. Higher depreciation and healthcare costs deleveraged operating expenses by 33 bps, and ROI fell to 14.9% from 15.3%.
Charts
Fourth quarter worked out from the annual figure.
Data
| Q3 FY25 | $169.6B |
| Q4 FY25 | $180.6B * |
| Q1 FY26 | $165.6B |
| Q2 FY26 | $177.4B |
| Q3 FY26 | $179.5B |
| Q4 FY26 | $190.7B * |
| Q1 FY27 | $177.8B |
| Q2 FY27 | $187.9B |
Data
| Q3 FY25 | $0.57 |
| Q1 FY26 | $0.56 |
| Q2 FY26 | $0.88 |
| Q3 FY26 | $0.77 |
| Q1 FY27 | $0.67 |
| Q2 FY27 | $0.80 |
Fourth-quarter EPS appears once the press release is read; filings report it only for the full year.
Data
| Q3 FY25 | 4.0% |
| Q4 FY25 | 4.4% |
| Q1 FY26 | 4.3% |
| Q2 FY26 | 4.1% |
| Q3 FY26 | 3.7% |
| Q4 FY26 | 4.6% |
| Q1 FY27 | 4.2% |
| Q2 FY27 | 5.0% |
Data
| Q3 FY25 | $372.0M |
| Q4 FY25 | $6.4B |
| Q1 FY26 | $425.0M |
| Q2 FY26 | $6.5B |
| Q3 FY26 | $1.9B |
| Q4 FY26 | $6.1B |
| Q1 FY27 | -$1.9B |
| Q2 FY27 | $7.5B |
Operating cash flow minus capital expenditure, from cash flow statements.
Questions
What were Walmart's headline results for Q1 FY27?
Total revenues were $177.8 billion, up 7.3%, or 5.9% in constant currency. GAAP EPS was $0.67, and adjusted EPS was $0.66, up 8.2%.
How did Walmart's profitability change in the quarter?
Operating income rose 5.0% to $7,493 million, but the operating margin was 4.3% versus 4.4% a year earlier. Fuel costs and higher depreciation and healthcare expenses weighed on results, while the gross profit rate rose 6 bps to 24.3%.
What is Walmart guiding for the second quarter?
Walmart expects constant-currency net sales growth of 4.0% to 5.0% and operating income growth of 7.0% to 10.0%. It expects adjusted EPS of $0.72 to $0.74.
Did Walmart change its fiscal 2027 outlook?
No, the full-year outlook is unchanged. It still includes net sales growth of 3.5% to 4.5% in constant currency and adjusted EPS of $2.75 to $2.85, and assumes no impact from IEEPA tariff refunds.
Why was free cash flow negative?
Free cash flow was negative $1.9 billion, a decrease of $2.4 billion. Capital expenditures rose $1.7 billion, and operating cash flow fell $0.7 billion on the timing of inventory receipts.