
Vertiv (VRT) · Industrials
Vertiv Q2 2026 earnings: summary, key numbers & outlook
Results filed 29 Jul 2026 · Quarter ended 30 Jun 2026
Slides (24 pages)Press release ↗Investor relations ↗
Summaries and transcripts are machine-generated and can contain errors.
In brief
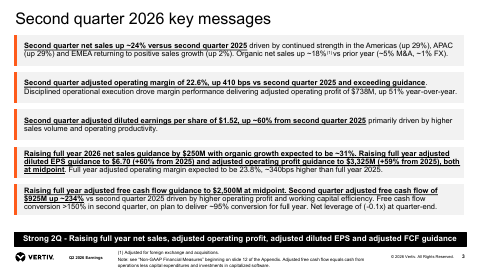
Vertiv reported second quarter net sales of $3,274 million, 24% higher than second quarter 2025, with diluted EPS up 53% to $1.27 and adjusted diluted EPS up 60% to $1.52.
Vertiv's second quarter net sales were $3,274 million, 24% higher than a year earlier. Organic growth was 18%, acquisitions added 5% and currency added 1%. Adjusted operating margin was 22.6%, up 410 basis points. Diluted EPS rose 53% to $1.27 and adjusted diluted EPS rose 60% to $1.52. Operating cash flow was $1,100 million, and the company ended the quarter with a net cash position.
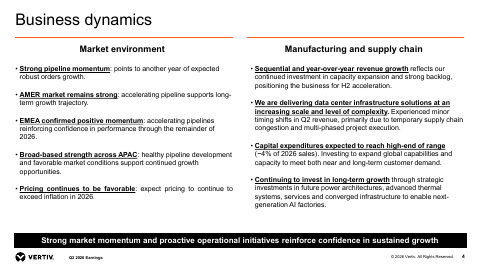
Management raised full year 2026 guidance on every key metric. It now expects net sales of $13,800M - $14,200M and adjusted diluted EPS of $6.65 - $6.75. Third quarter net sales are guided to $3,650M - $3,850M. The main tension is execution: Vertiv reported minor revenue timing shifts from supply chain congestion and complex multi-phase projects. Capital spending is also running at the high end, about 4.0% of revenue.
Slides & documents
Open the slide deck (PDF, 24 pages) ↗

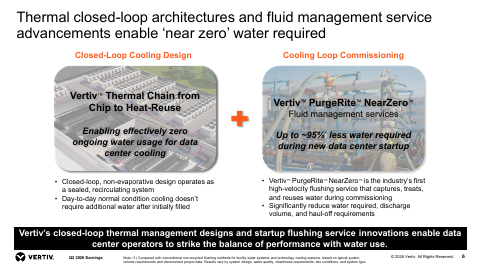
Showing the first 6 of 24 pages.
From Vertiv investor relations
SEC filing
Key numbers
- Net sales · GAAP
- $3,274 million
- Net income · GAAP
- $497.8M
- Diluted EPS · GAAP
- $1.27
- Adjusted diluted EPS · non-GAAP
- $1.52
- Operating profit · GAAP
- $638 million
- Adjusted operating profit · non-GAAP
- $738 million
- Adjusted operating margin · non-GAAP
- 22.6%
- Operating cash flow · GAAP
- $1,100 million
up 24% from second quarter 2025
up from $324.2 in second quarter 2025
up 53% from second quarter 2025
up 60% from second quarter 2025
up 44% from second quarter 2025
up 51% from second quarter 2025
up 410 basis points compared to second quarter 2025
up 241% from prior year second quarter
| Segment or metric | Value | Change |
|---|---|---|
| Americas (AMER) net sales | $2.1B | up 29.2%; organic up 21.1% |
| Asia Pacific (APAC) net sales | $719.9M | up 28.5%; organic up 25.7% |
| EMEA net sales | $483.6M | up 1.7%; organic down 2.4% |
Where each number comes from
- Net sales: “Net sales of $3,274 million, 24% higher than second quarter 2025.”
- Net income: “Net income (loss) | $497.8 | $324.2 | $887.9 | $488.7 Earnings (loss) per share: Basic | $1.29 | $0.85”
- Diluted EPS: “Diluted EPS grew 53% to $1.27 and adjusted diluted EPS grew 60% to $1.52 compared to second quarter 2025.”
- Adjusted diluted EPS: “Diluted EPS grew 53% to $1.27 and adjusted diluted EPS grew 60% to $1.52 compared to second quarter 2025.”
- Operating profit: “Second quarter operating profit of $638 million increased $196 million and adjusted operating profit of $738 million increased $249 million, up 44% and 51%, respectively”
- Adjusted operating profit: “Second quarter operating profit of $638 million increased $196 million and adjusted operating profit of $738 million increased $249 million, up 44% and 51%, respectively”
- Adjusted operating margin: “Adjusted operating margin of 22.6%, up 410 basis points compared to second quarter 2025.”
- Operating cash flow: “Operating cash flow of $1,100 million and adjusted free cash flow of $925 million, an increase of 241% and 234%, respectively, compared to prior year second quarter.”
- Americas (AMER) net sales: “Net sales(1) AMER | $2,070.8 | $1,602.3 | $468.5 | 29.2% | 21.1% | $3,885.2 | $2,787.6 | $1,097.6 | 39.4% | 31.0%”
- Asia Pacific (APAC) net sales: “APAC | 719.9 | 560.2 | 159.7 | 28.5% | 25.7% | 1,233.6 | 1,007.4 | 226.2 | 22.5% | 19.6%”
- EMEA net sales: “EMEA | 483.6 | 475.6 | 8.0 | 1.7% | (2.4)% | 805.0 | 879.1 | (74.1) | (8.4)% | (14.8)%”
Copied from the press release ↗ and other documents in the SEC filing ↗. A figure is published only if its sentence is in the filing.
| From the filing | Q2 2026 | vs year ago | vs last quarter |
|---|---|---|---|
| Revenue | $3.3B | +24.1% | +23.6% |
| Operating income | $637.9M | +44.2% | +44.9% |
| Net income | $497.8M | +53.5% | +27.6% |
| Diluted EPS | $1.27 | +53.0% | +28.3% |
| Free cash flow | $926.5M | +233.4% | +41.6% |
| Operating margin | 19.5% | +2.7 pts | +2.9 pts |
Calculated by code from XBRL, not by the model.
Outlook
| Metric | Period | Outlook |
|---|---|---|
| Net sales | third quarter of 2026 | $3,650M - $3,850M |
| Adjusted operating margin | third quarter of 2026 | 24.0% - 25.0% |
| Adjusted diluted EPS | third quarter of 2026 | $1.77 - $1.83 |
| Adjusted operating profit | third quarter of 2026 | $898M - $938M |
| Net sales | full year 2026 | $13,800M - $14,200M |
| Adjusted operating margin | full year 2026 | 23.3% - 24.3% |
| Adjusted diluted EPS | full year 2026 | $6.65 - $6.75 |
| Diluted EPS (GAAP) | full year 2026 | $5.82 to $5.92 |
| Adjusted operating profit | full year 2026 | $3,285M - $3,365M |
| Adjusted free cash flow | full year 2026 | $2,400M - $2,600M |
| Capital expenditures as share of revenue | full year 2026 | 4.0% |
Key takeaways
Margins expanded sharply on higher sales
Adjusted operating margin was 22.6%, up 410 basis points from second quarter 2025, driven by operational execution, productivity and favorable price-cost, inclusive of tariff impacts and associated countermeasures.
Cash generation jumped and net cash achieved
Operating cash flow was $1,100 million and adjusted free cash flow was $925 million. Vertiv ended the quarter with $5.6 billion of liquidity and a net cash position.
Full year guidance raised across all metrics
Full year net sales guidance is now $13,800M - $14,200M and adjusted diluted EPS is $6.65 - $6.75. Adjusted free cash flow is guided to $2,400M - $2,600M.
Americas drives growth while EMEA lags
Americas net sales rose 29.2% (21.1% organic), APAC rose 28.5% and EMEA rose only 1.7% with organic sales down 2.4%.
Timing shifts and heavier capex are watch items
Management cited minor revenue timing shifts from temporary supply chain congestion and multi-phased project execution. Capital expenditures are expected at about 4.0% of revenue for 2026.
Charts
Fourth quarter worked out from the annual figure.
Data
| Q4 2024 | $2.3B * |
| Q1 2025 | $2.0B |
| Q2 2025 | $2.6B |
| Q3 2025 | $2.7B |
| Q4 2025 | $2.9B * |
| Q1 2026 | $2.6B |
| Q2 2026 | $3.3B |
| Q3 2026 | $4.3B |
Data
| Q1 2025 | $0.42 |
| Q2 2025 | $0.83 |
| Q3 2025 | $1.02 |
| Q1 2026 | $0.99 |
| Q2 2026 | $1.27 |
| Q3 2026 | $1.95 |
Fourth-quarter EPS appears once the press release is read; filings report it only for the full year.
Data
| Q4 2024 | 19.5% |
| Q1 2025 | 14.3% |
| Q2 2025 | 16.8% |
| Q3 2025 | 19.3% |
| Q4 2025 | 20.1% |
| Q1 2026 | 16.6% |
| Q2 2026 | 19.5% |
| Q3 2026 | 22.8% |
Data
| Q4 2024 | $364.5M |
| Q1 2025 | $266.8M |
| Q2 2025 | $277.9M |
| Q3 2025 | $437.5M |
| Q4 2025 | $911.6M |
| Q1 2026 | $654.2M |
| Q2 2026 | $926.5M |
| Q3 2026 | $654.9M |
Operating cash flow minus capital expenditure, from cash flow statements.
Questions
What were Vertiv's headline results for Q2 2026?
Net sales were $3,274 million, up 24% from a year earlier, with diluted EPS of $1.27 (up 53%) and adjusted diluted EPS of $1.52 (up 60%). Adjusted operating margin was 22.6%.
What is Vertiv's guidance for the third quarter of 2026?
Vertiv expects net sales of $3,650M - $3,850M, adjusted operating profit of $898M - $938M, and adjusted diluted EPS of $1.77 - $1.83. Adjusted operating margin is guided to 24.0% - 25.0%.
Did Vertiv change its full year 2026 outlook?
Yes, it raised guidance across all key metrics. Net sales are now $13,800M - $14,200M, adjusted diluted EPS $6.65 - $6.75, and adjusted free cash flow $2,400M - $2,600M.
How strong was Vertiv's cash flow and balance sheet?
Operating cash flow was $1,100 million and adjusted free cash flow was $925 million, up 241% and 234% from the prior year. Vertiv ended the quarter with $5.6 billion of liquidity and a net cash position.
Which regions grew fastest in Q2 2026?
Americas net sales grew 29.2% (21.1% organic) and APAC grew 28.5% (25.7% organic). EMEA grew 1.7% but declined 2.4% organically.