
S&P Global (SPGI) · Exchanges & Data
S&P Global Q2 2026 earnings: summary, key numbers & outlook
Results filed 28 Jul 2026 · Quarter ended 30 Jun 2026
Slides (24 pages)Press release ↗Investor relations ↗
Summaries and transcripts are machine-generated and can contain errors.
In brief
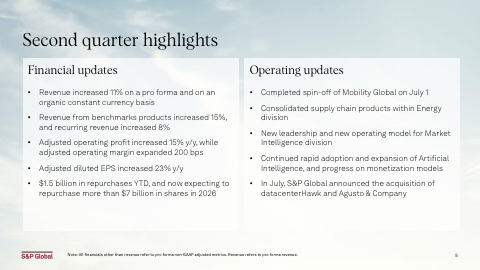
S&P Global completed the Mobility Global spin-off on July 1, leaving four core divisions, and reported rapid AI adoption, with 500+ active and trialing LLM-Ready API customers.
S&P Global's benchmark businesses led the quarter: Ratings and Indices both posted record results. Investment-grade issuance rose 25%, driven largely by financing for AI infrastructure and by M&A, and ETF assets tied to S&P Dow Jones Indices were up 34%. Customers are using AI products more. API call volume grew 5.4x from the first quarter, and AI customers in Market Intelligence and Energy expanded contracts faster than non-AI clients.
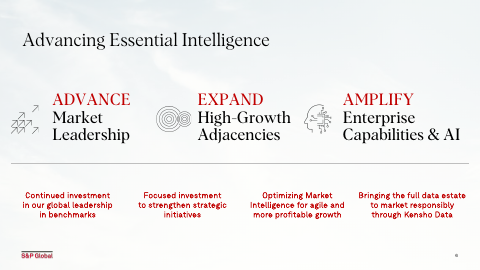
Management is steering the company toward four core divisions after the July 1 Mobility Global spin-off. It is consolidating supply chain products in Energy, giving Market Intelligence new leadership and an operating model, and buying datacenterHawk and Agusto & Company. The main tension is that customers now watch their AI token spend, expect returns, and some are building their own tools from S&P Global data instead of using third-party platforms.
No call transcript for this quarter, so this summary also draws on: Quartr ↗.
Slides & documents
Open the slide deck (PDF, 24 pages) ↗



Showing the first 6 of 24 pages.
From S&P Global investor relations
- WebcastWebcast replay ↗
- SupplementalFinancial tables ↗
- Event DetailsDocument ↗
- Ratings | Billed IssuanceDocument ↗
SEC filing
Key numbers
- Revenue (GAAP) · GAAP
- $4.146 billion
- Pro forma revenue (excluding Mobility)
- $3.678 billion
- Net income · GAAP
- $1.217 billion
- Operating profit · GAAP
- $1.812 billion
- Diluted EPS · GAAP
- $4.12
- Adjusted diluted EPS (pro forma) · non-GAAP
- $4.83
- Adjusted operating profit (pro forma) · non-GAAP
- $1.998 billion
- Adjusted operating margin · non-GAAP
- 54.3%
up 10% from a year ago
up 11% from a year ago
up 14%
up 17%
up 18%
up 23% from a year ago
up 15%
up 200 basis points
| Segment or metric | Value | Change |
|---|---|---|
| Ratings revenue | $1.3B | up 17% |
| Indices revenue | 534.0M | up 20% |
| Energy revenue | 568.0M | up 2% |
| Market Intelligence revenue | 1.3B | up 6% |
| Mobility revenue (discontinued) | 468.0M | up 7% |
Where each number comes from
- Revenue (GAAP): “The Company reported second-quarter 2026 GAAP revenue of $4.146 billion, an increase of 10% compared to the second quarter of 2025.”
- Pro forma revenue (excluding Mobility): “the Company reported on a pro forma basis that revenue increased 11% to $3.678 billion, operating profit increased 21% to $1.757 billion”
- Net income: “Second quarter GAAP operating profit increased 17% to $1.812 billion, GAAP net income increased 14% to $1.217 billion and GAAP diluted earnings per share increased 18% to $4.12.”
- Operating profit: “Second quarter GAAP operating profit increased 17% to $1.812 billion, GAAP net income increased 14% to $1.217 billion and GAAP diluted earnings per share increased 18% to $4.12.”
- Diluted EPS: “GAAP net income increased 14% to $1.217 billion and GAAP diluted earnings per share increased 18% to $4.12.”
- Adjusted diluted EPS (pro forma): “In the second quarter, adjusted operating profit increased 15% to $1.998 billion, and adjusted diluted EPS increased 23% to $4.83.”
- Adjusted operating profit (pro forma): “In the second quarter, adjusted operating profit increased 15% to $1.998 billion, and adjusted diluted EPS increased 23% to $4.83.”
- Adjusted operating margin: “The Company’s second-quarter reported operating profit margin increased by 410 basis points to 47.8%, and adjusted operating profit margin increased 200 basis points to 54.3%.”
- Ratings revenue: “Ratings | $1,339 | $1,148 | 17% | $2,641 | $2,297 | 15% Indices | 534 | 446 | 20%”
- Indices revenue: “Ratings | $1,339 | $1,148 | 17% | $2,641 | $2,297 | 15% Indices | 534 | 446 | 20%”
- Energy revenue: “Energy | 568 | 555 | 2% | 1,221 | 1,167 | 5% Market Intelligence | 1,290 | 1,217 | 6%”
- Market Intelligence revenue: “Energy | 568 | 555 | 2% | 1,221 | 1,167 | 5% Market Intelligence | 1,290 | 1,217 | 6%”
- Mobility revenue (discontinued): “Market Intelligence | 1,290 | 1,217 | 6% | 2,586 | 2,416 | 7% Mobility | 468 | 438 | 7% | 921 | 858 | 7%”
Copied from the press release ↗ and other documents in the SEC filing ↗. A figure is published only if its sentence is in those documents.
| From the filing | Q2 2026 | vs year ago | vs last quarter |
|---|---|---|---|
| Revenue | $4.1B | +10.4% | −0.6% |
| Operating income | $1.8B | +16.8% | −9.5% |
| Net income | $1.2B | +13.5% | −12.8% |
| Diluted EPS | $4.12 | +17.7% | −12.2% |
| Free cash flow | $1.4B | +1.2% | +38.7% |
| Operating margin | 43.7% | +2.4 pts | −4.3 pts |
Calculated by code from XBRL, not by the model.
Outlook
| Metric | Period | Outlook |
|---|---|---|
| Reported revenue growth (excluding Mobility) | full year 2026 | 5.9% to 7.9% |
| Organic constant currency revenue growth | full year 2026 | 6.0% to 8.0% |
| GAAP diluted EPS | full year 2026 | $16.35 to $16.60 |
| Adjusted diluted EPS | full year 2026 | $17.50 to $17.75 |
| Adjusted operating profit margin expansion | full year 2026 | 35 to 60 bps |
| Tax rate | full year 2026 | 22% to 23% |
| Capital expenditures | full year 2026 | $190 to $210 million |
| Share repurchases | 2026 | more than $7 billion |
Key takeaways
Mobility Global spin-off leaves four core divisions
S&P Global completed the spin-off on July 1, 2026, and Mobility Global now trades separately as MBGL. Management says the company now has a sharper focus on Ratings, Indices, Energy and Market Intelligence.
AI products are gaining measurable customer traction
Annualized contract value grew 1.6x faster among Market Intelligence clients using AI than among non-AI clients, and 3.0x faster in Energy. API call volume grew 5.4x versus the first quarter, with 500+ active and trialing LLM-Ready API customers.
AI infrastructure financing is driving ratings demand
Investment Grade billed issuance rose 25%, driven primarily by large issuances to finance AI infrastructure expansion, plus strong M&A issuance. Hyperscaler-related billed issuance reached $169 billion in the first half of 2026 and is outpacing the full-year estimate.
Indices benefits from ETF growth and volatility
ETF assets tied to S&P Dow Jones Indices reached $6,350 billion, up 34%, and a single S&P 500 ETF passed $1 trillion for the first time. Average daily exchange-traded derivatives volumes rose 19% as market volatility lifted demand.
Acquisitions and reorganization reshape Market Intelligence and Energy
S&P Global announced in July it will acquire datacenterHawk and Agusto & Company, adding to its data center and adjacency efforts. It also moved 451 Research and Maritime & Trade into Energy and reorganized Market Intelligence under new leadership.
Charts
Fourth quarter worked out from the annual figure.
Data
| Q4 2024 | $3.6B * |
| Q1 2025 | $3.8B |
| Q2 2025 | $3.8B |
| Q3 2025 | $3.4B |
| Q4 2025 | $5.2B * |
| Q1 2026 | $4.2B |
| Q2 2026 | $4.1B |
| Q3 2026 | $3.7B |
Data
| Q1 2025 | $3.54 |
| Q2 2025 | $3.50 |
| Q3 2025 | $3.86 |
| Q1 2026 | $4.69 |
| Q2 2026 | $4.12 |
| Q3 2026 | $4.25 |
Fourth-quarter EPS appears once the press release is read; filings report it only for the full year.
Data
| Q4 2024 | 36.4% |
| Q1 2025 | 41.8% |
| Q2 2025 | 41.3% |
| Q3 2025 | 45.2% |
| Q4 2025 | 38.4% |
| Q1 2026 | 48.0% |
| Q2 2026 | 43.7% |
| Q3 2026 | 53.2% |
Data
| Q4 2024 | $1.7B |
| Q1 2025 | $910.0M |
| Q2 2025 | $1.4B |
| Q3 2025 | $1.5B |
| Q4 2025 | $1.7B |
| Q1 2026 | $1.0B |
| Q2 2026 | $1.4B |
Operating cash flow minus capital expenditure, from cash flow statements.
Questions
What did S&P Global change in its structure this quarter?
It completed the Mobility Global spin-off on July 1, 2026, consolidated supply chain products into the Energy division, and gave Market Intelligence new leadership and an operating model.
How are customers adopting S&P Global's AI products?
API call volume grew 5.4x versus the first quarter, and 500+ customers are active or trialing LLM-Ready APIs. AI clients' annualized contract value grew 1.6x faster in Market Intelligence and 3.0x faster in Energy than non-AI clients.
What is driving demand in Ratings?
Investment Grade billed issuance rose 25%, driven primarily by large issuances financing AI infrastructure expansion, plus strong M&A issuance. Hyperscaler-related billed issuance was $169 billion in the first half of 2026.
What acquisitions did S&P Global announce?
In July it announced the acquisition of datacenterHawk and Agusto & Company. Data centers are also one of Energy's strategic focus areas.
What risks does management flag around AI and customers?
Customers are focusing on token expense and expecting higher returns on AI investments, and some are looking to build in-house solutions with S&P Global data rather than rely on third-party platforms. Market Intelligence also faces vendor consolidation and longer sales cycles for AI data demand.