
Snap (SNAP) · Internet & Advertising
Snap Q3 2026 earnings: summary, key numbers & outlook
Results filed 4 Nov 2026 · Quarter ended 30 Sep 2026
Slides (21 pages)Official transcript (PDF) ↗Press release ↗Investor relations ↗
Summaries and transcripts are machine-generated and can contain errors.
In brief
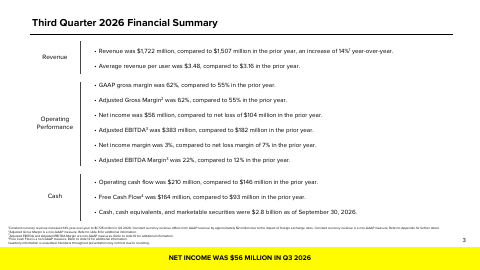
Snap reported Q3 2026 revenue of $1,722 million, up 14% year-over-year, net income of $56 million and Adjusted EBITDA of $383 million.
Snap's revenue grew 14% year-over-year to $1.72 billion in the third quarter. The company swung to a net income of $56 million from a net loss of $104 million a year earlier. Adjusted EBITDA rose to $383 million and free cash flow to $164 million. Advertising revenue grew only 4%, while Other Revenue, led by subscriptions such as Snapchat+ and Lens+, grew 84%. Daily users reached 495 million and monthly users 977 million.
For Q4, Snap guided revenue of $1.950 billion to $1.985 billion and Adjusted EBITDA of $490 million to $525 million, including planned investment in its SPECS augmented reality glasses. The main tension is that profit is improving while advertising growth, especially brand advertising, remains below management's ambitions. North America daily users are also shrinking. Management also flagged youth-related regulatory scrutiny as a risk, and said it will switch its main audience metric to monthly users in 2027.
Slides & documents
Open the slide deck (PDF, 21 pages) ↗

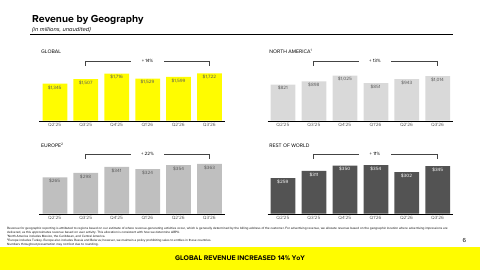
Showing the first 6 of 21 pages.
From Snap investor relations
- Prepared RemarksCFO commentary ↗
- Earnings Call TranscriptCompany's official transcript ↗
- WebcastWebcast replay ↗
- Form 10-K & 10-QDocument ↗
SEC filing
Key numbers
- Revenue · GAAP
- $1,722 million
- Net income · GAAP
- $56 million
- Diluted net income per share · GAAP
- $0.03
- GAAP gross margin · GAAP
- 62%
- Operating income · GAAP
- $76.7M
- Operating margin · GAAP
- 4%
- Operating cash flow · GAAP
- $210 million
- Free Cash Flow · non-GAAP
- $164 million
up 14% year-over-year
compared to net loss of $104 million in the prior year
compared to $(0.06) a year ago
compared to 55% in the prior year
160% change from a year ago
compared to $146 million in the prior year
compared to $93 million in the prior year
| Segment or metric | Value | Change |
|---|---|---|
| Daily Active Users | 495 million | up 4% year-over-year |
| Monthly Active Users | 977 million | up 4% year-over-year |
| Average revenue per user | $3.48 | compared to $3.16 in the prior year |
| North America revenue | $1.0B | up 13% year-over-year |
| Europe revenue | $362.9M | up 22% year-over-year |
| Rest of World revenue | $345.3M | up 11% year-over-year |
| Other Revenue growth | 84% | up 84% year-over-year |
| Paid subscribers | 30 million |
Where each number comes from
- Revenue: “Revenue was $1,722 million, compared to $1,507 million in the prior year, an increase of 14% year-over-year.”
- Net income: “Net income was $56 million, compared to net loss of $104 million in the prior year.”
- Diluted net income per share: “Diluted net income (loss) per share | $0.03 | $(0.06) | 150% | $(0.12) | $(0.30) | 60%”
- GAAP gross margin: “GAAP gross margin was 62%, compared to 55% in the prior year.”
- Operating income: “Operating income (loss) | $76,716 | $(128,362) | 160% | $(168,454) | $(581,884) | 71%”
- Operating margin: “Operating income (loss) - Margin | (19)% | (9)% | 3% | (5)% | (11)% | 4%”
- Operating cash flow: “Operating cash flow was $210 million, compared to $146 million in the prior year.”
- Free Cash Flow: “Free Cash Flow was $164 million, compared to $93 million in the prior year.”
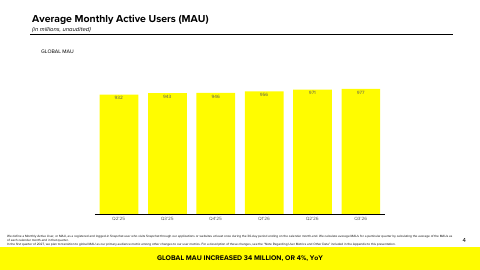
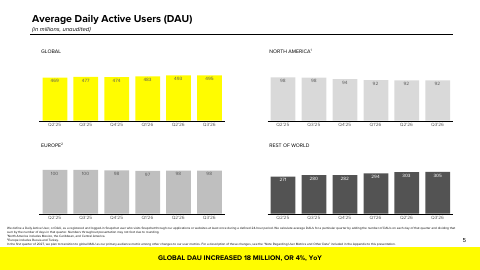
- Daily Active Users: “Daily Active Users grew to 495 million and Monthly Active Users grew to 977 million.”
- Monthly Active Users: “Daily Active Users grew to 495 million and Monthly Active Users grew to 977 million.”
- Average revenue per user: “Average revenue per user was $3.48, compared to $3.16 in the prior year.”
- North America revenue: “North America | $820,600 | $897,814 | $1,025,498 | $851,253 | $942,883 | $1,014,320”
- Europe revenue: “Europe | $265,343 | $297,950 | $341,134 | $323,852 | $353,806 | $362,850”
- Rest of World revenue: “Rest of World | $258,987 | $311,075 | $349,829 | $353,686 | $302,304 | $345,301”
- Other Revenue growth: “Advertising Revenue grew 4% and Other Revenue grew 84%, led by Snapchat+, Memories Storage, and Lens+.”
- Paid subscribers: “Other Revenue grew 84% year-over-year, and we surpassed 30 million paid subscribers across Snapchat+, Memories Storage, and Lens+.”
Copied from the press release ↗ and other documents in the SEC filing ↗. A figure is published only if its sentence is in the filing.
| From the filing | Q3 2026 | vs year ago | vs last quarter |
|---|---|---|---|
| Revenue | $1.7B | +14.3% | +7.7% |
| Operating income | $76.7M | — | — |
| Net income | $56.5M | — | — |
| Diluted EPS | $0.03 | — | — |
| Free cash flow | $164.5M | +76.0% | +36.4% |
| Operating margin | 4.5% | +13.0 pts | +15.2 pts |
Calculated by code from XBRL, not by the model.
Guidance check
| Metric | Outlook given with Q2 2026 | Reported | Result |
|---|---|---|---|
| Revenue | $1.70 billion to $1.74 billion | $1.7B | within the range |
Compared with the company's own guidance, not analyst estimates, and only where the outlook and the reported figure are the same measure on the same basis. Ranges are worked out by code from the company's wording. How this works.
Outlook
| Metric | Period | Outlook |
|---|---|---|
| Revenue | Q4 2026 | $1.950 billion to $1.985 billion |
| Adjusted EBITDA | Q4 2026 | $490 million to $525 million |
| Infrastructure Costs | full-year 2026 | $1.65 billion to $1.66 billion |
| All Other Cost of Revenue as share of revenue | full year 2026 | 16% to 17% |
Key takeaways
Snap turned profitable on 14% revenue growth
Revenue grew 14% year-over-year to $1.72 billion and net income was $56 million, versus a net loss of $104 million a year earlier. Total costs grew just 1%.
Operating leverage lifted Adjusted EBITDA to $383 million
Management said approximately 93% of incremental revenue flowed through to Adjusted EBITDA, for a margin of 22% versus 12% a year ago.
Advertising lags while subscriptions surge
Advertising Revenue grew 4% and Other Revenue grew 84%, with over 30 million paid subscribers. Upper funnel brand advertising declined year-over-year.
North America users keep shrinking
North America DAU was 92 million, down 6% year-over-year, while Rest of World DAU rose 9% to 305 million. Global DAU was 495 million and MAU was 977 million.
Q4 guidance points to continued acceleration
Snap guided Q4 revenue of $1.950 billion to $1.985 billion and Adjusted EBITDA of $490 million to $525 million. It will move to MAU as its primary audience metric from Q1 2027.
Charts
Fourth quarter worked out from the annual figure.
Data
| Q4 2024 | $1.6B * |
| Q1 2025 | $1.4B |
| Q2 2025 | $1.3B |
| Q3 2025 | $1.5B |
| Q4 2025 | $1.7B * |
| Q1 2026 | $1.5B |
| Q2 2026 | $1.6B |
| Q3 2026 | $1.7B |
Data
| Q1 2025 | -$0.08 |
| Q2 2025 | -$0.16 |
| Q3 2025 | -$0.06 |
| Q1 2026 | -$0.05 |
| Q2 2026 | -$0.10 |
| Q3 2026 | $0.03 |
Fourth-quarter EPS appears once the press release is read; filings report it only for the full year.
Data
| Q4 2024 | -1.7% |
| Q1 2025 | -14.2% |
| Q2 2025 | -19.3% |
| Q3 2025 | -8.5% |
| Q4 2025 | 2.9% |
| Q1 2026 | -4.9% |
| Q2 2026 | -10.7% |
| Q3 2026 | 4.5% |
Data
| Q4 2024 | $182.4M |
| Q1 2025 | $114.4M |
| Q2 2025 | $23.8M |
| Q3 2025 | $93.4M |
| Q4 2025 | $205.6M |
| Q1 2026 | $286.0M |
| Q2 2026 | $120.5M |
| Q3 2026 | $164.5M |
Operating cash flow minus capital expenditure, from cash flow statements.
Questions
What were Snap's Q3 2026 headline results?
Revenue rose 14% year-over-year to $1,722 million, net income was $56 million versus a $104 million net loss a year ago, and Adjusted EBITDA was $383 million. Free Cash Flow was $164 million.
What is Snap's guidance for Q4 2026?
Snap guided Q4 revenue of $1.950 billion to $1.985 billion and Adjusted EBITDA of $490 million to $525 million. Full-year Infrastructure Costs are now expected at $1.65 billion to $1.66 billion.
How is Snap's advertising business performing?
Advertising Revenue grew 4%, which management said remains below its ambitions. Direct response advertising grew strongly, but upper funnel brand advertising declined year-over-year.
How many users does Snapchat have, and how is that changing?
Snapchat had 495 million daily and 977 million monthly active users, each up 4% year-over-year. North America DAU fell 6% to 92 million, and Snap will make global MAU its primary audience metric starting with Q1 2027 results.
What are the main risks Snap highlighted?
Management pointed to evolving legal and regulatory scrutiny, including on youth-related issues, which could change products and raise legal costs and settlements. Slow advertising growth and share dilution, with total shares plus stock awards up 3.8%, are other pressure points.