
Snap (SNAP) · Internet & Advertising
Snap Q2 2026 earnings: summary, key numbers & outlook
Results filed 3 Aug 2026 · Quarter ended 30 Jun 2026
Slides (21 pages)Official transcript (PDF) ↗Press release ↗Investor relations ↗
Summaries and transcripts are machine-generated and can contain errors.
In brief
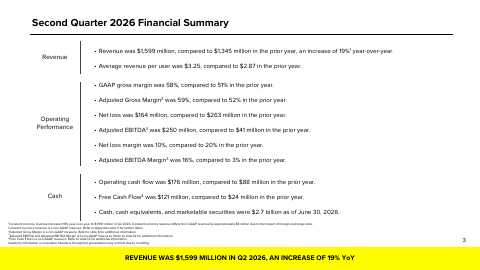
Second quarter revenue increased 19% year-over-year to $1,599 million; operating cash flow was $176 million and Free Cash Flow was $121 million; net loss of $164 million and Adjusted EBITDA of $250 million.
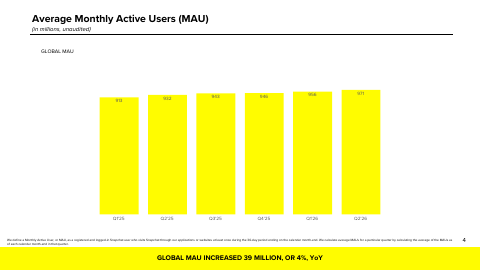
Snap's second-quarter revenue rose 19% to $1,599 million. Advertising Revenue grew 9% to $1.28 billion, while subscription-led Other Revenue grew 85% to $316 million. A cost restructuring helped gross margin reach 58% and Adjusted EBITDA reach $250 million, up from $41 million a year earlier. The net loss narrowed to $164 million, and Free Cash Flow was $121 million. Monthly Active Users reached 971 million.
For Q3, management guides revenue of $1.70 billion to $1.74 billion and Adjusted EBITDA of $300 million to $350 million, and it expects further savings from the restructuring. It also raised its full-year Infrastructure Costs outlook for AI. Key tensions are weaker North America user counts, heavy reliance on subscriptions for growth, SPECS glasses spending, and youth-related legal and regulatory trials later this year that could change products and hurt user growth.
Slides & documents
Open the slide deck (PDF, 21 pages) ↗

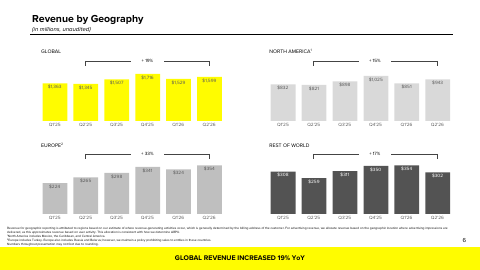
Showing the first 6 of 21 pages.
From Snap investor relations
- Prepared RemarksCFO commentary ↗
- Earnings Call TranscriptCompany's official transcript ↗
- WebcastWebcast replay ↗
- Form 10-K & 10-QDocument ↗
SEC filing
Key numbers
- Revenue · GAAP
- $1,599 million
- Net loss · GAAP
- $164 million
- Diluted net loss per share · GAAP
- $(0.10)
- GAAP gross margin · GAAP
- 58%
- Operating loss · GAAP
- -$170.7M
- Operating margin · GAAP
- (11)%
- Operating cash flow · GAAP
- $176 million
- Free Cash Flow · non-GAAP
- $121 million
up 19% year-over-year
compared to $263 million in the prior year
compared to $(0.16) in the prior year
compared to 51% in the prior year
compared to $(259,676) in the prior year
compared to (19)% in Q2 2025
compared to $88 million in the prior year
compared to $24 million in the prior year
| Segment or metric | Value | Change |
|---|---|---|
| Advertising Revenue | $1.28 billion | grew 9% |
| Other Revenue | $316 million | grew 85% |
| Monthly Active Users | 971 million | up 4% year-over-year |
| Daily Active Users | 493 million | up 5% year-over-year |
| Average revenue per user | $3.25 | compared to $2.87 in the prior year |
Where each number comes from
- Revenue: “Revenue was $1,599 million, compared to $1,345 million in the prior year, an increase of 19% year-over-year.”
- Net loss: “Net loss was $164 million, compared to $263 million in the prior year.”
- Diluted net loss per share: “Diluted net loss per share attributable to common stockholders | $(0.10) | $(0.16) | 38% | $(0.15) | $(0.24) | 38%”
- GAAP gross margin: “GAAP gross margin was 58%, compared to 51% in the prior year.”
- Operating loss: “Operating loss | $(170,721) | $(259,676) | 34% | $(245,170) | $(453,522) | 46%”
- Operating margin: “Operating income (loss) - Margin | (14)% | (19)% | (9)% | 3% | (5)% | (11)%”
- Operating cash flow: “Operating cash flow was $176 million, compared to $88 million in the prior year.”
- Free Cash Flow: “Free Cash Flow was $121 million, compared to $24 million in the prior year.”
- Advertising Revenue: “Advertising Revenue grew 9% to $1.28 billion, while Other Revenue grew 85% to $316 million.”
- Other Revenue: “Advertising Revenue grew 9% to $1.28 billion, while Other Revenue grew 85% to $316 million.”
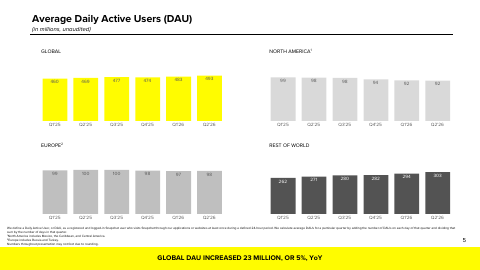
- Monthly Active Users: “Monthly Active Users grew to 971 million, and Daily Active Users reached 493 million.”
- Daily Active Users: “Monthly Active Users grew to 971 million, and Daily Active Users reached 493 million.”
- Average revenue per user: “Average revenue per user was $3.25, compared to $2.87 in the prior year.”
Copied from the press release ↗ and other documents in the SEC filing ↗. A figure is published only if its sentence is in the filing.
| From the filing | Q2 2026 | vs year ago | vs last quarter |
|---|---|---|---|
| Revenue | $1.6B | +18.9% | +4.6% |
| Operating income | -$170.7M | +34.3% | −129.3% |
| Net income | -$164.0M | +37.6% | −84.3% |
| Diluted EPS | -$0.10 | +37.5% | −100.0% |
| Free cash flow | $120.5M | +406.6% | −57.9% |
| Operating margin | -10.7% | +8.6 pts | −5.8 pts |
Calculated by code from XBRL, not by the model.
Outlook
| Metric | Period | Outlook |
|---|---|---|
| Revenue | Q3 2026 | $1.70 billion to $1.74 billion |
| Adjusted EBITDA | Q3 2026 | $300 million and $350 million |
| Infrastructure Costs | full-year 2026 | $1.65 billion to $1.70 billion |
| All Other Cost of Revenue, excluding Infrastructure Costs, as share of revenue | full-year 2026 | 16% to 17% |
| Adjusted Operating Expenses | full-year 2026 | approximately $2.75 billion |
| Stock-based compensation | full-year 2026 | approximately $1.05 billion |
Key takeaways
Revenue growth accelerated to 19%
Revenue grew 19% year-over-year to $1,599 million, up from 12% in Q1 2026 and 9% in Q2 2025. Constant currency growth was 18%.
Subscriptions are driving the growth mix
Other Revenue grew 85% to $316 million, led by Snapchat+, Memories Storage and Lens+, while Advertising Revenue grew 9% to $1.28 billion. Less than 3% of monthly active users pay.
Restructuring lifted margins and Adjusted EBITDA
Gross margin expanded seven percentage points to 58% and Adjusted EBITDA rose to $250 million from $41 million. Restructuring charges of $128.5 million were excluded from Adjusted EBITDA.
Free Cash Flow per share is the new goal
Free Cash Flow was $121 million, and $706 million over the past twelve months. Management expects a new multi-year dilution management program after the current repurchase program completes in Q4.
North America users fall as legal risks loom
North America DAU was 92 million, down 7% year-over-year, while Rest of World DAU reached 303 million. Management warned that youth-related trials later this year could hurt products, costs and user growth.
Charts
Fourth quarter worked out from the annual figure.
Data
| Q4 2024 | $1.6B * |
| Q1 2025 | $1.4B |
| Q2 2025 | $1.3B |
| Q3 2025 | $1.5B |
| Q4 2025 | $1.7B * |
| Q1 2026 | $1.5B |
| Q2 2026 | $1.6B |
| Q3 2026 | $1.7B |
Data
| Q1 2025 | -$0.08 |
| Q2 2025 | -$0.16 |
| Q3 2025 | -$0.06 |
| Q1 2026 | -$0.05 |
| Q2 2026 | -$0.10 |
| Q3 2026 | $0.03 |
Fourth-quarter EPS appears once the press release is read; filings report it only for the full year.
Data
| Q4 2024 | -1.7% |
| Q1 2025 | -14.2% |
| Q2 2025 | -19.3% |
| Q3 2025 | -8.5% |
| Q4 2025 | 2.9% |
| Q1 2026 | -4.9% |
| Q2 2026 | -10.7% |
| Q3 2026 | 4.5% |
Data
| Q4 2024 | $182.4M |
| Q1 2025 | $114.4M |
| Q2 2025 | $23.8M |
| Q3 2025 | $93.4M |
| Q4 2025 | $205.6M |
| Q1 2026 | $286.0M |
| Q2 2026 | $120.5M |
| Q3 2026 | $164.5M |
Operating cash flow minus capital expenditure, from cash flow statements.
Questions
What were Snap's key results in Q2 2026?
Revenue rose 19% to $1,599 million, net loss narrowed to $164 million, and Adjusted EBITDA was $250 million. Operating cash flow was $176 million and Free Cash Flow was $121 million.
What is Snap's Q3 2026 guidance?
Snap guided Q3 revenue of $1.70 billion to $1.74 billion and Adjusted EBITDA of $300 million to $350 million. It also raised full-year Infrastructure Costs guidance to $1.65 billion to $1.70 billion.
How are Snap's users trending?
Monthly Active Users reached 971 million and Daily Active Users 493 million, up 4% and 5% year-over-year. North America DAU fell 7% to 92 million, while Rest of World DAU grew 12% to 303 million.
What drove Snap's revenue growth?
Advertising Revenue grew 9% to $1.28 billion on large North American advertisers, Smart Campaign Solutions and small and medium-sized businesses. Other Revenue, mainly subscriptions, grew 85% to $316 million.
What are the main risks for Snap?
Management cited youth-related regulatory scrutiny and several U.S. trials later this year that could change products and raise legal costs. Snap is also still loss-making on a GAAP basis, though it expects sustained positive net income beginning in 2027.