
Regions Financial (RF) · Banking
Regions Financial Q2 2026 earnings: summary, key numbers & outlook
Results filed 17 Jul 2026 · Quarter ended 30 Jun 2026
Slides (39 pages)Official transcript (PDF) ↗Press release ↗Investor relations ↗
Summaries and transcripts are machine-generated and can contain errors.
In brief
Regions closed its July 1 acquisition of The Frazer Lanier Company to expand municipal finance and capital markets, while a new commercial lending platform went live and C&I lending broadened.
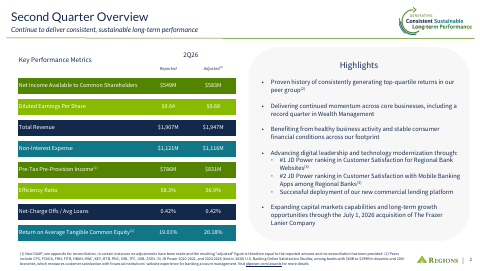
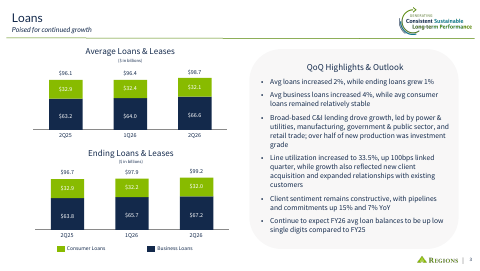
Regions grew business lending broadly, led by power and utilities, manufacturing, government and public sector, and retail trade, with over half of new production investment grade. Commercial line utilization rose to 33.5%, and pipelines and commitments were up 15% and 7% from a year ago. Wealth Management had another record quarter, and a new native mobile app launched with Zelle and chat usage at all-time highs.
Management is steering toward more capital markets and municipal finance capability through Frazer Lanier, continued hiring of client-facing bankers, and technology modernization, while keeping its rate-hedging program in place. The main tension is that Capital Markets revenue is expected to trend to the low end of its range in the third quarter amid market volatility and elevated rates. Proposed Basel III Endgame rules also add capital uncertainty.
Slides & documents
Open the slide deck (PDF, 39 pages) ↗

Showing the first 6 of 39 pages.
From Regions Financial investor relations
- Earnings TranscriptCompany's official transcript ↗
- Earnings WebcastWebcast replay ↗
- Financial SupplementFinancial tables ↗
- Quarterly Investors InformationDocument ↗
- 10-QDocument ↗
SEC filing
Key numbers
- Net income · GAAP
- $570.0M
- Diluted EPS · GAAP
- $0.64
- Adjusted diluted EPS · non-GAAP
- $0.68
- Efficiency ratio · GAAP
- 58.3%
up from $559 in 1Q26
up 8 percent compared to second quarter of 2025
up 13 percent compared to second quarter of 2025
vs 56.6% in 1Q26
| Segment or metric | Value | Change |
|---|---|---|
| Average loans | $98.7B | up 2.4% from 1Q26 |
| Wealth management income | $150.0M | up 12.8% from 2Q25 |
| Capital markets income | $84.0M | up 1.2% from 2Q25 |
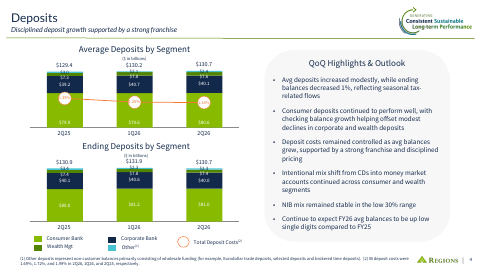
| Average deposits | $130.7B | up 0.4% from 1Q26 |
Where each number comes from
- Net income: “Net income | $570 | $559 Net income available to common shareholders | 549 | 539 Adj. net income avail. to common shareholders(1) | 583 | 539”
- Diluted EPS: “reported second quarter 2026 earnings of $549 million and diluted EPS of $0.64. On an adjusted basis, earnings(1) were $583 million, with diluted EPS(1) of $0.68.”
- Adjusted diluted EPS: “On an adjusted basis, earnings(1) were $583 million, with diluted EPS(1) of $0.68.”
- Efficiency ratio: “Efficiency ratio | 58.3 | 56.6 Adjusted efficiency ratio(1) | 56.9 | 56.6 Common equity Tier 1 ratio(2) | 10.7 | 10.7”
- Average loans: “Total Loans | $98,722 | $96,423 | $96,077 | $2,299 | 2.4% | $2,645 | 2.8%”
- Wealth management income: “Wealth management income | 150 | 141 | 133 | 9 | 6.4% | 17 | 12.8%”
- Capital markets income: “Capital markets income | 84 | 84 | 83 | — | —% | 1 | 1.2%”
- Average deposits: “Total Deposits | $130,691 | $130,234 | $129,444 | $457 | 0.4% | $1,247 | 1.0%”
Copied from the press release ↗ and other documents in the SEC filing ↗. A figure is published only if its sentence is in those documents.
| From the filing | Q2 2026 | vs year ago | vs last quarter |
|---|---|---|---|
| Net income | $570.0M | +1.2% | +2.0% |
| Diluted EPS | $0.64 | +8.5% | +3.2% |
Calculated by code from XBRL, not by the model.
Outlook
| Metric | Period | Outlook |
|---|---|---|
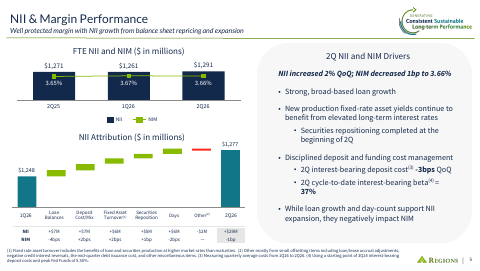
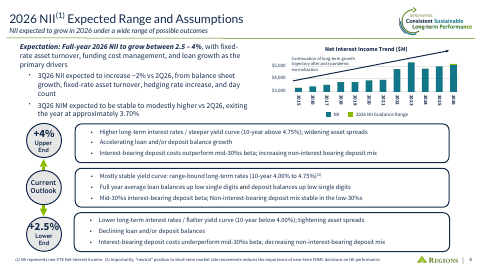
| Net interest income growth | full-year 2026 | up 2.5 – 4% |
| Net interest income vs 2Q26 | third quarter of 2026 | ~2% |
| Adjusted non-interest expense growth | full-year 2026 | up 1.5 – 3.5% |
| Effective tax rate | full-year 2026 | 20.5 – 21.5% |
Key takeaways
Frazer Lanier deal expands municipal finance capabilities
Regions completed the July 1, 2026 acquisition of The Frazer Lanier Company to broaden capital markets, municipal finance and investment banking for public, corporate and institutional clients.
Commercial lending growth is broad and high quality
C&I growth was led by power and utilities, manufacturing, government and public sector, and retail trade, with over half of new production investment grade. Line utilization rose to 33.5%.
New commercial lending platform is now live
Regions deployed a platform enabling real-time processing and mobile-enabled tools for loan origination and servicing. New commercial logos are up 37% year to date.
Digital adoption deepens with new mobile app
A new native mobile app launched with Zelle and chat usage at all-time highs and chat volume up 70% year over year. Mobile log-ins reached 6.81 million.
Wealth Management posts another record quarter
Wealth income hit a record, the fifth in six quarters, helped by new advisors who have driven about $6B in client assets growth over three years. Regions also launched a Donor-Advised Funds solution.
Charts
Data
| Q1 2025 | $0.51 |
| Q2 2025 | $0.59 |
| Q3 2025 | $0.61 |
| Q1 2026 | $0.62 |
| Q2 2026 | $0.64 |
| Q3 2026 | $0.71 |
Fourth-quarter EPS appears once the press release is read; filings report it only for the full year.
Questions
What acquisition did Regions complete this quarter?
Regions acquired The Frazer Lanier Company on July 1, 2026, expanding municipal finance, capital markets and investment banking capabilities.
Where is Regions' loan growth coming from?
Broad-based C&I lending led by power and utilities, manufacturing, government and public sector, and retail trade, with over half of new production investment grade.
How is Regions investing in digital and technology?
It launched a new native mobile app, deployed a new commercial lending platform, and is piloting an AI branch coaching tool with over 2,500 practice simulations.
What is the outlook for Capital Markets?
Management expects quarterly revenue of $90 – $105M, trending toward the lower end in 3Q26 amid market volatility and elevated rates, with momentum building after.
How could Basel III Endgame affect Regions?
The proposal would include AOCI in regulatory capital, but proposed standardized approach changes are expected to cut risk-weighted assets by about 10%, adding roughly 100 basis points to capital once fully implemented.