
Prudential Financial (PRU) · Insurance
Prudential Financial Q3 2026 earnings: summary, key numbers & outlook
Results filed 15 Oct 2026 · Quarter ended 30 Sep 2026
Slides (23 pages)Official transcript (PDF) ↗Press release ↗Investor relations ↗
Summaries and transcripts are machine-generated and can contain errors.
In brief
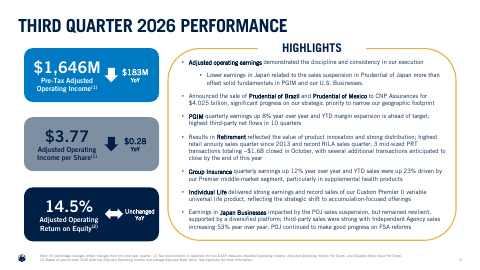
Prudential agreed to sell its Brazil and Mexico businesses for $4.025 billion as it narrows its geographic footprint, while a longer Prudential of Japan sales suspension weighed on results.
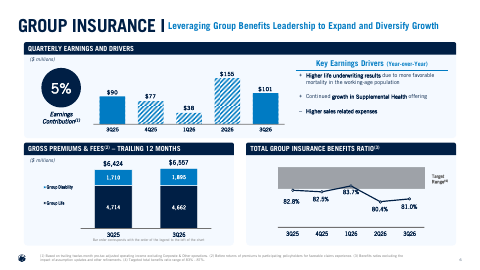
Prudential's Retirement and Group Insurance businesses showed strong demand. It posted its highest retail annuity sales quarter since 2013 and a record quarter for its RILA annuity (FlexGuard), and three mid-sized pension risk transfer deals closed in October. Group Insurance sales were up 23% year to date, led by supplemental health for middle-market employers. Individual Life set a record for its Custom Premier II variable universal life product, and PGIM had its highest third-party net flows in 10 quarters.
Management is steering toward a simpler, more focused company by exiting emerging markets and redirecting proceeds toward targeted acquisitions. The main risk is Japan: the Prudential of Japan sales suspension is now FSA-ordered, the restart has slipped to a phased return beginning February 1, and management still expects about a 15% reduction in that unit's in-force earnings power. Remediation could take longer than expected.
No call transcript for this quarter, so this summary also draws on: Earnings Whispers (via Finviz) ↗, Prudential Financial ↗.
Slides & documents
Open the slide deck (PDF, 23 pages) ↗

Showing the first 6 of 23 pages.
From Prudential Financial investor relations
- 3Q26 Earnings Presentation View PresentationSlide deck ↗
- TranscriptCompany's official transcript ↗
- DocumentDocument ↗
- DocumentDocument ↗
SEC filing
Key numbers
- Net income attributable to Prudential Financial · GAAP
- $1.4B
- Net income per share · GAAP
- $3.96
- After-tax adjusted operating income per share · non-GAAP
- $3.77
- Pre-tax adjusted operating income · non-GAAP
- $1.6B
- Adjusted operating return on equity · non-GAAP
- 14.9%
vs $1,431 in the prior-year quarter
vs $4.01 in the prior-year quarter
down $0.28 year over year
down $183M year over year
vs 16.6% in the prior-year quarter
| Segment or metric | Value | Change |
|---|---|---|
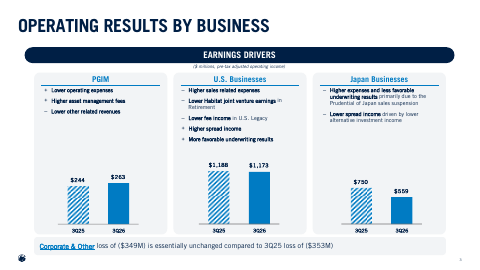
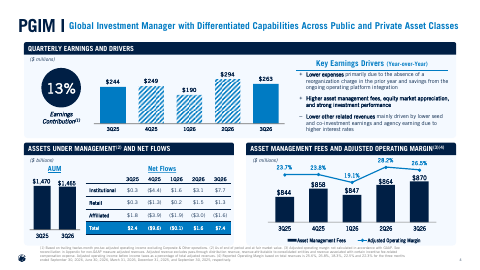
| PGIM pre-tax adjusted operating income | $263.0M | up 8% year over year |
| Individual Life pre-tax adjusted operating income | $199.0M | vs $153 in 3Q25 |
| Japan Businesses pre-tax adjusted operating income | $559.0M | vs $750 in 3Q25 |
Where each number comes from
- Net income attributable to Prudential Financial: “Net income (loss) attributable to Prudential Financial, Inc. $ 1,388 $ 1,431 $ 2,970 $ 2,671”
- Net income per share: “Net income (loss) per share attributable to Prudential Financial, Inc. $ 3.96 $ 4.01 $ 8.43 $ 7.44”
- After-tax adjusted operating income per share: “After-tax adjusted operating income per share $ 3.77 $ 4.05 $ 10.91 $ 10.49”
- Pre-tax adjusted operating income: “Adjusted operating income before income taxes $ 1,646 $ 1,829 $ 4,807 $ 4,783”
- Adjusted operating return on equity: “Adjusted Operating Return on Equity(2) 14.9% 16.6% 14.5% 14.5%”
- PGIM pre-tax adjusted operating income: “$1,188 $1,173 $263 $244 $750 $559 3Q25 3Q26”
- Individual Life pre-tax adjusted operating income: “$186 $199 + More favorable underwriting, driven by a reserve refinement $176 $153”
- Japan Businesses pre-tax adjusted operating income: “$1,188 $1,173 $263 $244 $750 $559 3Q25 3Q26”
Copied from the press release ↗ and other documents in the SEC filing ↗. A figure is published only if its sentence is in those documents.
| From the filing | Q3 2026 | vs year ago | vs last quarter |
|---|---|---|---|
| Revenue | $14.4B | −19.2% | −7.7% |
| Net income | $1.4B | −3.0% | +40.9% |
| Diluted EPS | $3.96 | −1.2% | +41.4% |
Calculated by code from XBRL, not by the model.
Key takeaways
Brazil and Mexico sold to CNP Assurances
Prudential announced the sale of Prudential of Brazil and Prudential of Mexico to CNP Assurances for $4.025 billion. It is described as significant progress on narrowing the geographic footprint, and the businesses now sit in Other Divested and Run-off Businesses.
Prudential of Japan suspension is longer and FSA-ordered
The restart slipped from early November to a phased return beginning February 1, and management still expects roughly a 15% reduction in in-force earnings power. Japan Businesses carried about $140M of suspension costs this quarter, so the duration of remediation is the key swing factor.
Retirement posted record RILA and annuity sales
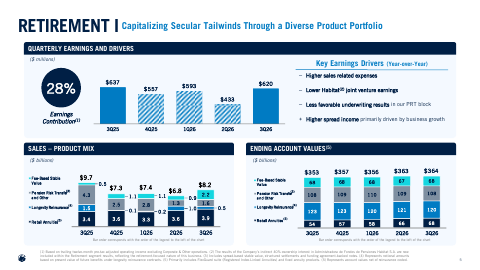
Retail annuities had their highest sales quarter since 2013 and RILA sales set a record, supported by strong distribution. Three mid-sized pension risk transfer transactions totaling about $1.6B closed in October, with more expected by year-end.
Group Insurance growth driven by supplemental health
Year-to-date sales rose 23%, led by the Premier middle-market segment and supplemental health products. This diversifies growth beyond core group life and disability.
PGIM flows turned positive in third-party channels
PGIM had its highest third-party net flows in 10 quarters, and its active ETF platform has topped $40 billion. Year-to-date margin expansion is ahead of target, helped by operating platform integration savings.
Charts
Fourth quarter worked out from the annual figure.
Data
| Q4 2024 | $12.5B * |
| Q1 2025 | $13.5B |
| Q2 2025 | $13.7B |
| Q3 2025 | $17.9B |
| Q4 2025 | $15.7B * |
| Q1 2026 | $15.5B |
| Q2 2026 | $15.7B |
| Q3 2026 | $14.4B |
Data
| Q1 2025 | $1.96 |
| Q2 2025 | $1.48 |
| Q3 2025 | $4.01 |
| Q1 2026 | $1.68 |
| Q2 2026 | $2.80 |
| Q3 2026 | $3.96 |
Fourth-quarter EPS appears once the press release is read; filings report it only for the full year.
Questions
What is happening with the Prudential of Japan sales suspension?
The suspension is now FSA-ordered, and the restart has slipped from early November to a phased return beginning February 1. Management still expects roughly a 15% reduction in Prudential of Japan's in-force earnings power, and it is making progress on FSA reforms.
Why is Prudential selling its Brazil and Mexico businesses?
The $4.025 billion sale to CNP Assurances advances a strategic priority to narrow Prudential's geographic footprint. Proceeds are earmarked for targeted acquisitions in a competitive market.
Where is Prudential seeing product demand in the U.S.?
Retirement had its highest retail annuity sales quarter since 2013 and a record RILA quarter. Individual Life had record Custom Premier II variable universal life sales, and Group Insurance sales are up 23% year to date on supplemental health.
How is PGIM performing as an asset manager?
PGIM had its highest third-party net flows in 10 quarters, and year-to-date margin expansion is ahead of target. Its active ETF platform has topped $40 billion.
What is the outlook for pension risk transfer?
Three mid-sized transactions totaling about $1.6B closed in October, and several more are anticipated to close by the end of this year.