
Pinterest (PINS) · Internet & Advertising
Pinterest Q3 2026 earnings: summary, key numbers & outlook
Results filed 29 Oct 2026 · Quarter ended 30 Sep 2026
Slides (22 pages)Official transcript (PDF) ↗Press release ↗Investor relations ↗
Summaries and transcripts are machine-generated and can contain errors.
In brief
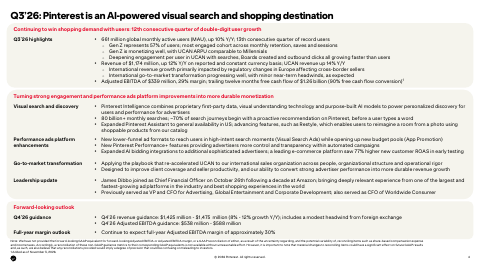
Pinterest's Q3 2026 revenue was $1,174 million, up 12%, with GAAP net income of $22 million and a record 661 million monthly active users.
Pinterest grew revenue 12% to $1,174 million in the third quarter and reached a record 661 million monthly active users, up 10%. The U.S. and Canada led with 14% revenue growth, while Europe was flat. GAAP net income fell 77% to $22 million as costs rose and interest income shrank. Adjusted EBITDA, a profit measure that excludes stock pay and other items, rose 11% to $339 million.
For the fourth quarter, management expects revenue of $1,425 million to $1,475 million, or 8% to 12% growth, and Adjusted EBITDA of $538 million to $588 million. It still expects a full-year Adjusted EBITDA margin of about 30%. The main tension is that user growth and U.S. monetization are strong, while Europe is hurt by regulatory changes affecting cross-border sellers and international sales is being reorganized. A new CFO also started on October 26.
Slides & documents
Open the slide deck (PDF, 22 pages) ↗


Showing the first 6 of 22 pages.
From Pinterest investor relations
SEC filing
Key numbers
- Revenue · GAAP
- $1,174 million
- Net income · GAAP
- $22 million
- Diluted EPS · GAAP
- $0.04
- Non-GAAP net income per share · non-GAAP
- $0.46
- Income from operations · GAAP
- $30.3M
- Net cash provided by operating activities · GAAP
- $316 million
- Free cash flow · non-GAAP
- $300 million
- Adjusted EBITDA · non-GAAP
- $339 million
up 12% from a year ago
down 77% from a year ago
down from $0.13 a year ago
up from $0.38 a year ago
down from 58,516 a year ago
down 2% from a year ago
down 6% from a year ago
up 11% from a year ago
| Segment or metric | Value | Change |
|---|---|---|
| Global monthly active users | 661 million | up 10% from a year ago |
| Revenue - U.S. and Canada | $894.0M | up 14% from a year ago |
| Revenue - Europe | $193.0M | flat from a year ago |
| Revenue - Rest of World | $87.0M | up 24% from a year ago |
| Global ARPU | $1.80 | up 1% from a year ago |
| U.S. and Canada ARPU | $8.38 | up 10% from a year ago |
| Europe ARPU | $1.21 | down 7% from a year ago |
Where each number comes from
- Revenue: “Revenue was $1,174 million, growing 12% year over year on a reported and constant currency basis.”
- Net income: “GAAP net income was $22 million and Adjusted EBITDA was $339 million.”
- Diluted EPS: “Net income (loss) per share: Basic | $0.04 | $0.14 | $(0.17) | $0.21 Diluted | $0.04 | $0.13 | $(0.17) | $0.20”
- Non-GAAP net income per share: “Diluted weighted-average shares used in computing non-GAAP net income per share | 582,652 | 694,532 Non-GAAP net income per share | $0.46 | $0.38 Reconciliation of free cash flow”
- Income from operations: “Total costs and expenses | 1,143,591 | 990,689 | 3,466,249 | 2,883,711 Income (loss) from operations | 30,338 | 58,516 | (105,152) | 18,709”
- Net cash provided by operating activities: “Net cash provided by operating activities was $316 million and free cash flow was $300 million.”
- Free cash flow: “Net cash provided by operating activities was $316 million and free cash flow was $300 million.”
- Adjusted EBITDA: “GAAP net income was $22 million and Adjusted EBITDA was $339 million.”
- Global monthly active users: “Global Monthly Active Users ("MAUs") increased 10% year over year to 661 million.”
- Revenue - U.S. and Canada: “Revenue - Global | $1,174 | $1,049 | 12% Revenue - U.S. and Canada | $894 | $786 | 14% Revenue - Europe | $193 | $193 | —%”
- Revenue - Europe: “Revenue - Global | $1,174 | $1,049 | 12% Revenue - U.S. and Canada | $894 | $786 | 14% Revenue - Europe | $193 | $193 | —%”
- Revenue - Rest of World: “Revenue - Europe | $193 | $193 | —% Revenue - Rest of World | $87 | $70 | 24% MAUs - Global | 661 | 600 | 10%”
- Global ARPU: “ARPU - Global | $1.80 | $1.78 | 1% ARPU - U.S. and Canada | $8.38 | $7.64 | 10% ARPU - Europe | $1.21 | $1.31 | (7)%”
- U.S. and Canada ARPU: “ARPU - Global | $1.80 | $1.78 | 1% ARPU - U.S. and Canada | $8.38 | $7.64 | 10% ARPU - Europe | $1.21 | $1.31 | (7)%”
- Europe ARPU: “ARPU - Global | $1.80 | $1.78 | 1% ARPU - U.S. and Canada | $8.38 | $7.64 | 10% ARPU - Europe | $1.21 | $1.31 | (7)%”
Copied from the press release ↗ and other documents in the SEC filing ↗. A figure is published only if its sentence is in the filing.
| From the filing | Q3 2026 | vs year ago | vs last quarter |
|---|---|---|---|
| Revenue | $1.2B | +11.9% | −0.5% |
| Operating income | $30.3M | −48.2% | — |
| Net income | $21.5M | −76.6% | — |
| Diluted EPS | $0.04 | −69.2% | — |
| Free cash flow | $300.3M | −5.7% | +11.2% |
| Operating margin | 2.6% | −3.0 pts | +7.3 pts |
Calculated by code from XBRL, not by the model.
Guidance check
| Metric | Outlook given with Q2 2026 | Reported | Result |
|---|---|---|---|
| Revenue | $1,190 million to $1,210 million | $1.2B | below the range |
Compared with the company's own guidance, not analyst estimates, and only where the outlook and the reported figure are the same measure on the same basis. Ranges are worked out by code from the company's wording. How this works.
Outlook
| Metric | Period | Outlook |
|---|---|---|
| Revenue | Q4 2026 | $1,425 million to $1,475 million |
| Adjusted EBITDA | Q4 2026 | $538 million to $588 million |
| Adjusted EBITDA margin | full-year 2026 | approximately 30% |
Key takeaways
Revenue growth held at 12% on record users
Revenue was $1,174 million, up 12% on a reported and constant currency basis, while global monthly active users rose 10% to 661 million.
U.S. and Canada drove growth; Europe was flat
U.S. and Canada revenue rose 14% to $894 million and Rest of World rose 24%, while Europe was flat at $193 million. Europe ARPU fell 7%, which management tied to regulatory changes affecting cross-border sellers.
GAAP profit fell sharply despite higher EBITDA
GAAP net income dropped 77% to $22 million, while Adjusted EBITDA rose 11% to $339 million. Share-based compensation was $288,249 thousand and interest income, net, fell to $6,022 thousand from $28,536 thousand.
Q4 guidance implies growth of 8% to 12%
Pinterest guided Q4 revenue to $1,425 million to $1,475 million and Adjusted EBITDA to $538 million to $588 million. It still expects a full-year Adjusted EBITDA margin of approximately 30%.
Buybacks and acquisition reshaped the balance sheet
Cash and marketable securities fell as the company repurchased $2,024,886 thousand of Class A stock in the nine months and issued convertible notes. Fully diluted shares were down 12% year over year, and a new CFO joined on October 26.
Charts
Fourth quarter worked out from the annual figure.
Data
| Q4 2024 | $1.2B * |
| Q1 2025 | $855.0M |
| Q2 2025 | $998.2M |
| Q3 2025 | $1.0B |
| Q4 2025 | $1.3B * |
| Q1 2026 | $1.0B |
| Q2 2026 | $1.2B |
| Q3 2026 | $1.2B |
Data
| Q1 2025 | $0.01 |
| Q2 2025 | $0.06 |
| Q3 2025 | $0.13 |
| Q1 2026 | -$0.12 |
| Q2 2026 | -$0.08 |
| Q3 2026 | $0.04 |
Fourth-quarter EPS appears once the press release is read; filings report it only for the full year.
Data
| Q4 2024 | 22.7% |
| Q1 2025 | -4.1% |
| Q2 2025 | -0.4% |
| Q3 2025 | 5.6% |
| Q4 2025 | 22.8% |
| Q1 2026 | -8.0% |
| Q2 2026 | -4.7% |
| Q3 2026 | 2.6% |
Data
| Q4 2024 | $250.2M |
| Q1 2025 | $356.4M |
| Q2 2025 | $196.7M |
| Q3 2025 | $318.4M |
| Q4 2025 | $380.4M |
| Q1 2026 | $311.7M |
| Q2 2026 | $269.9M |
| Q3 2026 | $300.3M |
Operating cash flow minus capital expenditure, from cash flow statements.
Questions
How did Pinterest perform in Q3 2026?
Revenue was $1,174 million, up 12% year over year, and monthly active users hit a record 661 million, up 10%. GAAP net income was $22 million and Adjusted EBITDA was $339 million.
What is Pinterest's guidance for Q4 2026?
Pinterest expects Q4 revenue of $1,425 million to $1,475 million, representing 8% - 12% growth, and Adjusted EBITDA of $538 million to $588 million. It still expects a full-year Adjusted EBITDA margin of approximately 30%.
Why did GAAP net income fall 77%?
Net income was $22 million versus $92 million a year earlier. Costs and expenses rose faster than revenue, interest income, net, dropped to $6,022 thousand from $28,536 thousand, and income taxes were a $13,613 thousand provision versus a $4,912 thousand benefit a year ago.
Which regions grew fastest?
Rest of World revenue grew 24% and U.S. and Canada grew 14%, while Europe was flat. Management said international revenue growth was mainly affected by regulatory changes in Europe affecting cross-border sellers.
How much cash did Pinterest generate?
Operating cash flow was $316 million, down 2%, and free cash flow was $300 million, down 6%. Trailing twelve-month free cash flow was $1.26 billion, or 90% of Adjusted EBITDA.