
Pinterest (PINS) · Internet & Advertising
Pinterest Q2 2026 earnings: summary, key numbers & outlook
Results filed 4 Aug 2026 · Quarter ended 30 Jun 2026
Slides (23 pages)Official transcript (PDF) ↗Press release ↗Investor relations ↗
Summaries and transcripts are machine-generated and can contain errors.
In brief
Pinterest reported Q2 2026 revenue of $1,180 million, up 18%, with 640 million global monthly active users and a GAAP net loss of $47 million.
Pinterest grew revenue 18% to $1,180 million (17% in constant currency) and reached a record 640 million monthly active users, up 11%. Adjusted EBITDA was $311 million, up 24%. The company still posted a GAAP net loss of $47 million, against net income a year ago, as share-based compensation and restructuring costs weighed. It also completed over $2 billion of share repurchases year-to-date.
For Q3 2026, management expects revenue of $1,190 million to $1,210 million, or 13% to 15% growth, and Adjusted EBITDA of $335 million to $355 million. It raised its full-year Adjusted EBITDA margin outlook to approximately 30%. The main tension is slowing revenue growth from 18% to a guided 13% to 15%, alongside rising share-based compensation, a GAAP loss, and a smaller cash balance after the buybacks.
Slides & documents
Open the slide deck (PDF, 23 pages) ↗

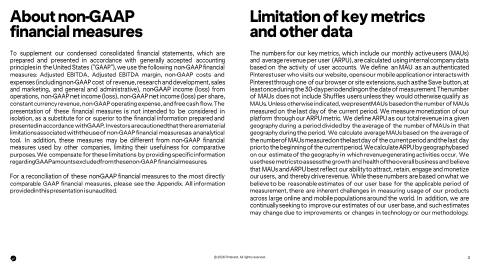
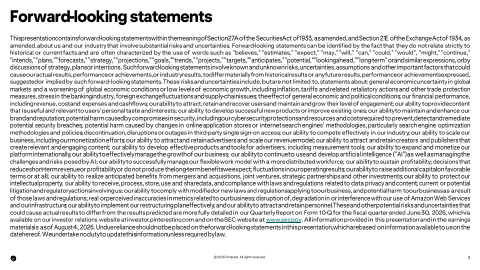
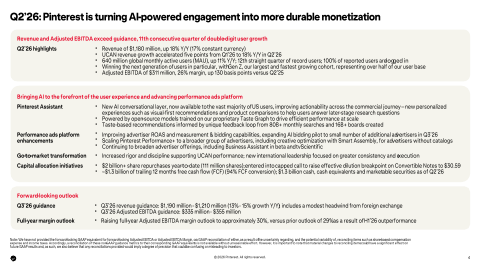
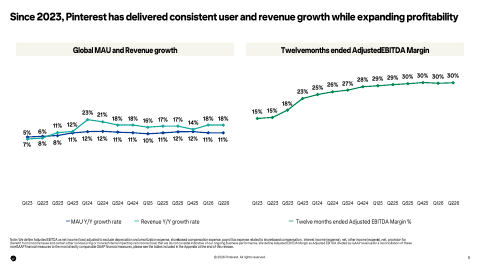

Showing the first 6 of 23 pages.
From Pinterest investor relations
SEC filing
Key numbers
- Revenue · GAAP
- $1,180 million
- Net loss · GAAP
- $47 million
- Diluted EPS · GAAP
- $(0.08)
- Non-GAAP net income per share · non-GAAP
- $0.43
- Loss from operations · GAAP
- -$55.2M
- Net cash provided by operating activities · GAAP
- $293 million
- Free cash flow · non-GAAP
- $270 million
- Adjusted EBITDA · non-GAAP
- $311 million
up 18% from a year ago (17% constant currency)
up from $0.33 a year ago
vs. loss of (4,330) a year ago
up 41% from a year ago
up 37% from a year ago
up 24% from a year ago
| Segment or metric | Value | Change |
|---|---|---|
| Global monthly active users | 640 million | up 11% from a year ago |
| Revenue - U.S. and Canada | $880.0M | up 18% |
| Revenue - Europe | $213.0M | up 12% |
| Revenue - Rest of World | $87.0M | up 38% |
| Global ARPU | $1.86 | up 7% |
| U.S. and Canada ARPU | $8.30 | up 14% |
Where each number comes from
- Revenue: “Revenue was $1,180 million, growing 18% year over year. On a constant currency basis, revenue would have grown 17% year over year.”
- Net loss: “GAAP net loss was $47 million and Adjusted EBITDA was $311 million.”
- Diluted EPS: “Net income (loss) per share: Basic | $(0.08) | $0.06 | $(0.20) | $0.07 Diluted | $(0.08) | $0.06 | $(0.20) | $0.07”
- Non-GAAP net income per share: “Diluted weighted-average shares used in computing non-GAAP net income per share | 577,628 | 689,837 Non-GAAP net income per share | $0.43 | $0.33”
- Loss from operations: “Total costs and expenses | 1,234,852 | 1,002,557 | 2,322,658 | 1,893,022 Loss from operations | (55,198) | (4,330) | (135,490) | (39,807)”
- Net cash provided by operating activities: “Net cash provided by operating activities was $293 million and free cash flow was $270 million.”
- Free cash flow: “Net cash provided by operating activities was $293 million and free cash flow was $270 million.”
- Adjusted EBITDA: “GAAP net loss was $47 million and Adjusted EBITDA was $311 million.”
- Global monthly active users: “Global Monthly Active Users ("MAUs") increased 11% year over year to 640 million.”
- Revenue - U.S. and Canada: “Revenue - Global | $1,180 | $998 | 18% Revenue - U.S. and Canada | $880 | $745 | 18% Revenue - Europe | $213 | $191 | 12% Revenue - Rest of World | $87 | $63 | 38%”
- Revenue - Europe: “Revenue - Global | $1,180 | $998 | 18% Revenue - U.S. and Canada | $880 | $745 | 18% Revenue - Europe | $213 | $191 | 12% Revenue - Rest of World | $87 | $63 | 38%”
- Revenue - Rest of World: “Revenue - Global | $1,180 | $998 | 18% Revenue - U.S. and Canada | $880 | $745 | 18% Revenue - Europe | $213 | $191 | 12% Revenue - Rest of World | $87 | $63 | 38%”
- Global ARPU: “ARPU - Global | $1.86 | $1.74 | 7% ARPU - U.S. and Canada | $8.30 | $7.29 | 14%”
- U.S. and Canada ARPU: “ARPU - Global | $1.86 | $1.74 | 7% ARPU - U.S. and Canada | $8.30 | $7.29 | 14%”
Copied from the press release ↗ and other documents in the SEC filing ↗. A figure is published only if its sentence is in the filing.
| From the filing | Q2 2026 | vs year ago | vs last quarter |
|---|---|---|---|
| Revenue | $1.2B | +18.2% | +17.1% |
| Operating income | -$55.2M | −1174.8% | +31.3% |
| Net income | -$46.7M | — | +36.6% |
| Diluted EPS | -$0.08 | — | +33.3% |
| Free cash flow | $269.9M | +37.2% | −13.4% |
| Operating margin | -4.7% | −4.3 pts | +3.3 pts |
Calculated by code from XBRL, not by the model.
Outlook
| Metric | Period | Outlook |
|---|---|---|
| Revenue | Q3 2026 | $1,190 million to $1,210 million |
| Adjusted EBITDA | Q3 2026 | $335 million to $355 million |
| Adjusted EBITDA margin | full-year 2026 | approximately 30% |
Key takeaways
Revenue growth of 18% led by U.S. and Canada
Revenue was $1,180 million, up 18%, and U.S. and Canada revenue was $880 million, also up 18%. Rest of World grew fastest at 38%.
Record 640 million users, growth in every region
Global MAUs rose 11% to 640 million, with Rest of World up 15%, Europe up 8% and U.S. and Canada up 4%. Global ARPU rose 7% to $1.86.
GAAP net loss despite higher Adjusted EBITDA
GAAP net loss was $47 million, while Adjusted EBITDA rose 24% to $311 million. Share-based compensation was $319,729 thousand versus $227,234 thousand a year ago.
Over $2 billion in buybacks funded by convertible notes
Pinterest repurchased over $2 billion of shares year-to-date at an average price of $18.17. Convertible notes of $981,128 thousand now appear on the balance sheet, and cash and marketable securities fell.
Q3 guidance implies slower growth, higher margin
Q3 revenue guidance of $1,190 million to $1,210 million represents 13% - 15% growth, below Q2's 18%. Management raised the full-year Adjusted EBITDA margin outlook to approximately 30% from 29%.
Charts
Fourth quarter worked out from the annual figure.
Data
| Q4 2024 | $1.2B * |
| Q1 2025 | $855.0M |
| Q2 2025 | $998.2M |
| Q3 2025 | $1.0B |
| Q4 2025 | $1.3B * |
| Q1 2026 | $1.0B |
| Q2 2026 | $1.2B |
| Q3 2026 | $1.2B |
Data
| Q1 2025 | $0.01 |
| Q2 2025 | $0.06 |
| Q3 2025 | $0.13 |
| Q1 2026 | -$0.12 |
| Q2 2026 | -$0.08 |
| Q3 2026 | $0.04 |
Fourth-quarter EPS appears once the press release is read; filings report it only for the full year.
Data
| Q4 2024 | 22.7% |
| Q1 2025 | -4.1% |
| Q2 2025 | -0.4% |
| Q3 2025 | 5.6% |
| Q4 2025 | 22.8% |
| Q1 2026 | -8.0% |
| Q2 2026 | -4.7% |
| Q3 2026 | 2.6% |
Data
| Q4 2024 | $250.2M |
| Q1 2025 | $356.4M |
| Q2 2025 | $196.7M |
| Q3 2025 | $318.4M |
| Q4 2025 | $380.4M |
| Q1 2026 | $311.7M |
| Q2 2026 | $269.9M |
| Q3 2026 | $300.3M |
Operating cash flow minus capital expenditure, from cash flow statements.
Questions
What were Pinterest's Q2 2026 headline results?
Revenue was $1,180 million, up 18% (17% in constant currency), with 640 million global monthly active users, up 11%. GAAP net loss was $47 million and Adjusted EBITDA was $311 million.
Is Pinterest profitable?
On a GAAP basis it reported a net loss of $47 million in Q2 2026, versus net income of $38,755 thousand a year ago. Non-GAAP net income was $249,518 thousand, or $0.43 per share.
What is Pinterest's Q3 2026 guidance?
Pinterest expects Q3 revenue of $1,190 million to $1,210 million, or 13% - 15% growth, and Adjusted EBITDA of $335 million to $355 million. It also raised its full-year Adjusted EBITDA margin outlook to approximately 30% from 29%.
How much cash did Pinterest generate and return to shareholders?
Operating cash flow was $293 million and free cash flow was $270 million. The company completed over $2 billion of share repurchases year-to-date at an average price of $18.17.
Where is growth strongest by region?
Rest of World revenue grew 38% to $87 million and MAUs grew 15%. U.S. and Canada, the largest region, grew revenue 18% to $880 million with ARPU up 14% to $8.30.