
Progressive (PGR) · Insurance
Progressive Q2 2026 earnings: summary, key numbers & outlook
Results filed 15 Jul 2026 · Quarter ended 30 Jun 2026
Slides (42 pages)Press release ↗Investor relations ↗
Summaries and transcripts are machine-generated and can contain errors.
In brief
Progressive says its Property turnaround is substantially complete and is now pushing to win 'Robinsons' households, which buy auto and home together, with homeowners insurance open in 41 states.
Progressive's customer base grew to 40,086 thousand policies in force, with Direct auto up 10% and Agency auto up 8%. Management used its investor presentation to argue that Property, after deliberately slowed growth in 2024 and 2025, is healthy enough to grow again. Homeowners is now written in states representing 82% of the property insurance market, up from 40% in May 2025.
Management is steering toward the Robinsons segment, customers who bundle auto and home, which it sizes at about $230B of premium where it holds only a 3.9% share. The main tension is that the Property turnaround cost it agent competitiveness: rate increases and tighter underwriting pushed its product out of favor, and Agency Robinsons growth has been flat. Winning back agents without repeating past weather-driven volatility is the central risk.
No call transcript for this quarter, so this summary also draws on: VectorShift ↗.
Slides & documents
Open the slide deck (PDF, 42 pages) ↗


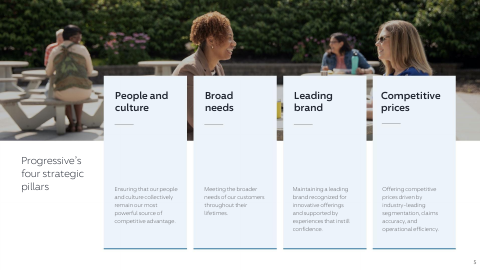
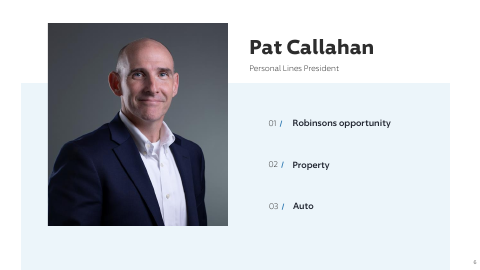
Showing the first 6 of 42 pages.
From Progressive investor relations
SEC filing
Key numbers
- Net income (quarter) · GAAP
- $3.3B
- Per share available to common shareholders (quarter) · GAAP
- $5.67
- Net premiums written (quarter)
- $21.1B
- Net premiums earned (quarter)
- $21.6B
- Combined ratio (quarter) · GAAP
- 87.3
up 4% from a year ago
up 5% from a year ago
up 5% from a year ago
up 6% from a year ago
up 1.1 points from a year ago
| Segment or metric | Value | Change |
|---|---|---|
| Total policies in force | 40.1M | up 7% |
| Direct auto policies in force | 16.7M | up 10% |
| Agency auto policies in force | 11.2M | up 8% |
| Special lines policies in force | 7.3M | up 7% |
| Property policies in force | 3.6M | up 1% |
| Commercial Lines policies in force | 1.2M | up 3% |
Where each number comes from
- Net income (quarter): “Net income | $779 | $1,124 | (31)% | $3,311 | $3,175 | 4% Per share available to common shareholders | $1.34 | $1.91 | (30)% | $5.67 | $5.40 | 5%”
- Per share available to common shareholders (quarter): “Net income | $779 | $1,124 | (31)% | $3,311 | $3,175 | 4% Per share available to common shareholders | $1.34 | $1.91 | (30)% | $5.67 | $5.40 | 5%”
- Net premiums written (quarter): “Net premiums written | $6,772 | $6,605 | 3% | $21,077 | $20,076 | 5% Net premiums earned | $7,100 | $6,954 | 2% | $21,573 | $20,310 | 6%”
- Net premiums earned (quarter): “Net premiums written | $6,772 | $6,605 | 3% | $21,077 | $20,076 | 5% Net premiums earned | $7,100 | $6,954 | 2% | $21,573 | $20,310 | 6%”
- Combined ratio (quarter): “Combined ratio | 90.0 | 86.6 | 3.4 | pts. | 87.3 | 86.2 | 1.1 | pts. Average diluted equivalent common shares | 583.1 | 588.0 | (1)% | 584.2 | 587.8 | (1)%”
- Total policies in force: “Total Personal Lines | 38,860 | 36,126 | 8 Commercial Lines | 1,226 | 1,189 | 3 Total | 40,086 | 37,315 | 7”
- Direct auto policies in force: “Policies in Force Personal Lines Agency – auto | 11,211 | 10,423 | 8 Direct – auto | 16,721 | 15,245 | 10 Special lines | 7,297 | 6,850 | 7”
- Agency auto policies in force: “Policies in Force Personal Lines Agency – auto | 11,211 | 10,423 | 8 Direct – auto | 16,721 | 15,245 | 10 Special lines | 7,297 | 6,850 | 7”
- Special lines policies in force: “Direct – auto | 16,721 | 15,245 | 10 Special lines | 7,297 | 6,850 | 7 Property | 3,631 | 3,608 | 1 Total Personal Lines | 38,860 | 36,126 | 8”
- Property policies in force: “Special lines | 7,297 | 6,850 | 7 Property | 3,631 | 3,608 | 1 Total Personal Lines | 38,860 | 36,126 | 8 Commercial Lines | 1,226 | 1,189 | 3”
- Commercial Lines policies in force: “Total Personal Lines | 38,860 | 36,126 | 8 Commercial Lines | 1,226 | 1,189 | 3 Total | 40,086 | 37,315 | 7”
Copied from the press release ↗ and other documents in the SEC filing ↗. A figure is published only if its sentence is in those documents.
| From the filing | Q2 2026 | vs year ago | vs last quarter |
|---|---|---|---|
| Revenue | $23.6B | +7.3% | +6.4% |
| Net income | $3.3B | +4.3% | +17.5% |
| Diluted EPS | $5.67 | +5.0% | +18.1% |
| Free cash flow | $3.5B | −11.9% | −19.4% |
Calculated by code from XBRL, not by the model.
Key takeaways
Robinsons bundled households are the growth target
Progressive estimates the Robinsons segment at about $230B of premium with a 3.9% share, versus 26.6% in Diane and 16.7% in Wrights. Robinsons households in Agency have about 5x the lifetime earned premium of Sam households.
Property turnaround is described as substantially complete
Property combined ratio improved after rate increases, better segmentation, risk selection models and exposure management, and the status is shown as nearing completion. Management says it is now pursuing disciplined growth once a market is healthy.
Homeowners availability expanded to 41 states
Green states went from 18 in May 2025 to 41 in June 2026, covering 82% of the property insurance market versus 40% before. Countrywide HO3 availability is 2.2x its June 2024 level.
Agent competitiveness is the main Property hurdle
Management admits rate hikes and profit-focused rules made the product less competitive and pushed it out of agents' consideration. Fixes include rate reductions where possible, adjusting cost-share mandates, and easier agent systems, while Agency Robinsons auto growth was 0% in 2025.
Direct and Agency auto policies keep growing
Direct auto policies in force rose 10% and Agency auto 8% to 16,721 and 11,211 thousand. Management says Direct has consistently grown and Agency is primed to benefit as the Property product improves.
Charts
Fourth quarter worked out from the annual figure.
Data
| Q4 2024 | $20.3B * |
| Q1 2025 | $20.4B |
| Q2 2025 | $22.0B |
| Q3 2025 | $22.5B |
| Q4 2025 | $22.7B * |
| Q1 2026 | $22.2B |
| Q2 2026 | $23.6B |
| Q3 2026 | $23.2B |
Data
| Q1 2025 | $4.37 |
| Q2 2025 | $5.40 |
| Q3 2025 | $4.45 |
| Q1 2026 | $4.80 |
| Q2 2026 | $5.67 |
| Q3 2026 | $4.37 |
Fourth-quarter EPS appears once the press release is read; filings report it only for the full year.
Data
| Q4 2024 | $2.9B |
| Q1 2025 | $5.1B |
| Q2 2025 | $3.9B |
| Q3 2025 | $5.1B |
| Q4 2025 | $3.0B |
| Q1 2026 | $4.3B |
| Q2 2026 | $3.5B |
| Q3 2026 | $4.4B |
Operating cash flow minus capital expenditure, from cash flow statements.
Questions
What is Progressive's main strategic focus after Q2 2026?
Winning Robinsons households that buy auto and home together, a segment it sizes at about $230B of premium where its share is only 3.9%. Management calls the segment's lifetime value roughly 5x that of Sam households in Agency.
Is Progressive growing its homeowners business again?
Yes, cautiously. After deliberately slowing Property growth in 2024 and 2025, it now writes homeowners in 41 states covering 82% of the property insurance market, versus 18 states and 40% in May 2025.
How did Progressive fix its Property profitability problem?
Management cites rate increases, improved pricing and segmentation, risk selection models and exposure management. It cut its share of high-weather-risk insured value by 23% since 2022 and a 33% modeled decrease in 1:100 year probable maximum loss.
Where is Progressive's auto customer growth coming from?
Direct auto policies in force grew 10% and Agency auto 8% year over year. Management says Wrights, auto customers who own homes, are its largest and fastest growing segment.
What challenges does Progressive face in the independent agent channel?
Its Property product became less competitive on price and less attractive to agents during the turnaround, and Agency Robinsons auto growth was 0% in 2025. It is responding with rate cuts where possible, easier binding, new agent appointments and richer bundle incentives.