
OCBC (O39) · Banking
OCBC Q3 2026 earnings: summary, key numbers & outlook
Results filed 6 Nov 2026 · Quarter ended 30 Sep 2026
Slides (4 pages)Press release ↗Investor relations ↗
Summaries and transcripts are machine-generated and can contain errors.
In brief
OCBC's Wealth Management and Wholesale Banking franchises drove record Banking Operations profit, led by record customer flow trading income, while Great Eastern's investment losses weighed on Group results.
OCBC's banking business had a record quarter as customers brought more wealth and corporate business. Banking Wealth Management assets under management reached a new high of S$358 billion, with net new money inflows from all wealth segments. Customer flow trading income, driven by corporates, hit a record. Loans grew 14% year-on-year, led by TMT, digital infrastructure, transportation, power and utilities, consumer wealth and Singapore mortgages. Great Eastern's underlying insurance sales stayed healthy even as market-driven investment losses cut its profit.
Management is steering toward its Next Frontier strategy, aiming to tap growth sectors such as AI and related technology, and says it is well positioned for higher interest rates. It has again upgraded 2026 guidance. The main tension is external: the Middle East conflict and energy prices, and conditions in Indonesia, remain uncertain. Rising US rates also squeezed margins this quarter because funding repriced faster than assets, though benefits should come as assets reprice.
No call transcript for this quarter, so this summary also draws on: The Edge Malaysia ↗, Wealth Briefing Asia ↗, The Star (Reuters) ↗, Seedly/Beansprout ↗.
Slides & documents
Open the slide deck (PDF, 4 pages) ↗
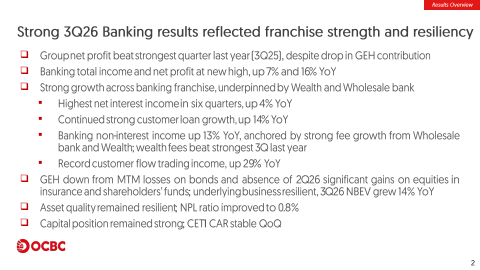
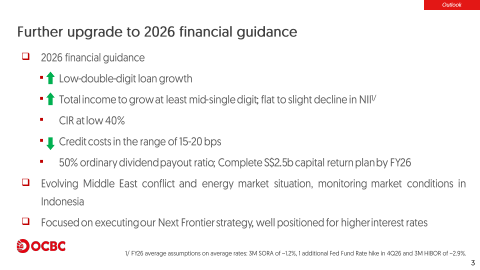

From OCBC investor relations
Results documents
Key numbers
- Total income
- S$3.73b
- Group net profit
- S$2.04 billion
- EPS (annualised)
- 1.78
- Operating profit before allowances
- 2.2B
- Net interest margin
- 1.66%
down 2% from a year ago
up 3% from a year ago
up 3% from a year ago
down 3% from a year ago
down 18bps from a year ago
| Segment or metric | Value | Change |
|---|---|---|
| Banking Wealth Management AUM | S$358 billion | up 2% from the prior quarter |
| Customer loans | S$372 billion | up 14% from a year ago |
| Customer flow trading income | S$480 million | record; up 29% from a year ago |
| Banking Operations profit | S$1.90 billion | up 8% from the prior quarter |
| Customer deposits | S$461 billion | up 12% from a year ago |
| Sustainable financing loans | S$62.0 billion | up 13% from a year ago |
| Great Eastern NBEV margin | 57.5% | from 51.0% in the previous quarter |
Where each number comes from
- Total income: “3Q26 Performance Highlights YoY QoQ Total Income S$3.73b -2% -11% -8% QoQ Net Interest Income S$2.31b +4% +2% Group S$2.04b Non-Interest Income S$1.42b”
- Group net profit: “Group net profit for the third quarter (“3Q26”) was S$2.04 billion, up 3% year-on-year.”
- EPS (annualised): “Group EPS (S$) – annualised 1.78 1.72 +3 1.96 -9 Group ROE – annualised 13.1% 13.4% -0.3ppt 14.4% -1.3ppt”
- Operating profit before allowances: “Operating profit before allowances 2,211 2,277 -3 2,595 -15 Allowances (52) (139) -63 (156) -67”
- Net interest margin: “Net Interest Margin 1.66% -18bps -4bps Credit Costs 6bps -10bps -8bps -9% QoQ EPS Customer Loans S$372b”
- Banking Wealth Management AUM: “Banking WM AUM grew 2% to a new high of S$358 billion, with continued net new money inflows from all wealth segments.”
- Customer loans: “Customer loans were S$372 billion as at 30 September 2026, up 14% from the previous year and 3% higher than a quarter ago”
- Customer flow trading income: “Customer flow trading income rose to a record S$480 million driven by growth across all segments, in particular corporates”
- Banking Operations profit: “Banking Operations profit rose 8% to a record S$1.90 billion in 3Q26, supported by loan growth”
- Customer deposits: “Customer deposits rose 12% year-on-year to S$461 billion, driven by growth in both CASA deposits and fixed deposits.”
- Sustainable financing loans: “Sustainable financing loans increased 13% from a year ago to S$62.0 billion as at 30 September 2026”
- Great Eastern NBEV margin: “margins improved to 57.5% from 51.0% in the previous quarter due to a more favourable product mix.”
Copied from the press release ↗ and other documents in the company's results page ↗. A figure is published only if its sentence is in those documents.
Outlook
| Metric | Period | Outlook |
|---|---|---|
| Cost-to-income ratio | 2026 | low 40 % |
| Credit costs | 2026 | 15-20 bps |
| Ordinary dividend payout ratio | 2026 | 50% |
Key takeaways
Wealth Management assets hit a record S$358 billion
Banking WM AUM grew 2% on the quarter, with net new money inflows from all wealth segments. Wealth fees were 62% of 9M26 fee income, making wealth the core fee engine.
Customer flow trading income reached an all-time high
Record income came from growth across all segments, especially corporates, and 9M26 customer flow income rose 40% on wealth-related and corporate hedging activity. It shows client-driven demand rather than proprietary trading.
Loan growth is broad, led by digital infrastructure
Loans grew 14% year-on-year, led by TMT, digital infrastructure, transportation, power and utilities, real estate in developed markets, consumer wealth and Singapore mortgages. This ties the loan book to AI-related growth sectors.
Great Eastern's sales strong despite investment losses
NBEV rose 14% on more than 20% growth in Singapore agency and bancassurance channels, and NBEV margin improved to 57.5% on product mix. Profit fell on mark-to-market bond losses as rates rose, not on weaker sales.
Management positions for rising US and SORA rates
Higher US rates hurt margins this quarter, but management expects the benefit as assets reprice in coming quarters. Guidance was upgraded again, with loan growth in the low double digits.
Questions
What drove OCBC's record Banking Operations profit?
Wealth Management and Wholesale Banking growth, including record customer flow trading income, strong fees and 14% year-on-year loan growth. Benign credit costs also helped.
How is Great Eastern performing?
Its underlying business is resilient, with NBEV up 14% and more than 20% growth in Singapore agency and bancassurance channels. Profit was hit by mark-to-market bond losses as interest rates rose.
Where is OCBC's loan growth coming from?
Growth was broad across geographies and industries, led by TMT, digital infrastructure, transportation, power and utilities, developed-market real estate, consumer wealth and Singapore mortgages. Sustainable financing loans reached S$62.0 billion, 17% of customer loans.
What is OCBC's strategy and outlook?
It is executing its Next Frontier strategy, targeting growth sectors including AI and related technology, and sees itself well positioned for higher interest rates. It has upgraded 2026 guidance while monitoring the Middle East conflict, energy prices and Indonesia.
How did rising US rates affect OCBC this quarter?
They pressured margins because funding costs repriced faster than assets, while higher SORA rates were a net positive. Management expects benefits from higher US rates to appear in coming quarters as assets reprice.