“To date, we have signed 26 SCAs, which we currently estimate to be over 35 % of our revenue through 2030.”
It sizes how much of future revenue is covered by multi-year take-or-pay contracts.

Micron (MU) · Semiconductors
Results filed 30 Sep 2026 · Quarter ended 3 Sep 2026 · Call 61 min · Sanjay Mehrotra (CEO), Mark Murphy (CFO)
Read the transcriptSlides (51 pages)Press release ↗Investor relations ↗
Summaries and transcripts are machine-generated and can contain errors.
Micron reported fiscal fourth-quarter 2026 revenue of $54.23 billion, GAAP net income of $37.70 billion, or $32.87 per diluted share, and non-GAAP net income of $38.40 billion, or $33.42 per diluted share.
Micron posted record fiscal fourth-quarter revenue of $54.23 billion, up from $11.32 billion a year earlier and $41.46 billion in the prior quarter. Non-GAAP gross margin reached 87.0% and non-GAAP diluted EPS was $33.42. Operating cash flow was $43.97 billion. Management said AI-driven demand for memory and storage is far outrunning supply, and full-year revenue was $133.19 billion.
For the first quarter of fiscal 2027, Micron guided to revenue of $61.5 billion plus or minus $1.5 billion and a non-GAAP gross margin of approximately 86.25%. It expects that quarter to be the gross-margin floor for the year. The main tension is cost: higher incentive pay, startup costs and rising capital spending, with first-half capex of about $25 billion, must be weighed against a market management says stays supply constrained through 2028.
Open the slide deck (PDF, 51 pages) ↗



Showing the first 6 of 51 pages.
From Micron investor relations
SEC filing
up 379% year-over-year
up 33 % sequentially
up 210 basis points sequentially
up 110 basis points sequentially
versus $5.73 billion for the same period last year
| Segment or metric | Value | Change |
|---|---|---|
| Cloud Memory Business Unit revenue | $16.3B | up 18% sequentially |
| Core Data Center Business Unit revenue | $18.0B | up 56% sequentially |
| Mobile and Client Business Unit revenue | $13.1B | up 14% sequentially |
| Automotive and Embedded Business Unit revenue | $6.8B | up 47% sequentially |
| DRAM revenue | $39.8 billion | up 343 % year-over-year |
| NAND revenue | $14.1 billion | up 526% year-over-year |
| Data center SSD revenue | nearly $10 billion | more than 10 times the year-ago quarter |
Copied from the press release ↗ and other documents in the SEC filing ↗. A figure is published only if its sentence is in the filing.
| From the filing | Q4 FY2026 | vs year ago | vs last quarter |
|---|---|---|---|
| Revenue | $54.2B | +379.3% | +30.8% |
| Operating income | $43.8B | +1097.3% | +31.3% |
| Net income | $37.7B | +1077.8% | +33.5% |
| Free cash flow | $32.9B | +45543.1% | +87.1% |
| Gross margin | 86.8% | +42.1 pts | +2.2 pts |
| Operating margin | 80.7% | +48.4 pts | +0.3 pts |
Calculated by code from XBRL, not by the model.
| Metric | Outlook given with Q3 FY2026 | Reported | Result |
|---|---|---|---|
| Revenue | $50.0 billion ± $1.0 billion | $54.2B | above the range |
| Gross margin (GAAP) | Approximately 86% | 86.8% | see outlook |
| EPS (GAAP) | $30.73 ± $1.00 | $32.87 | above the range |
Compared with the company's own guidance, not analyst estimates, and only where the outlook and the reported figure are the same measure on the same basis. Ranges are worked out by code from the company's wording. How this works.
| Metric | Period | Outlook |
|---|---|---|
| Non-GAAP revenue | first quarter of fiscal 2027 | $61.5 billion ± $1.5 billion |
| Non-GAAP gross margin | first quarter of fiscal 2027 | Approximately 86.25% |
| Non-GAAP operating expenses | first quarter of fiscal 2027 | Approximately $2.06 billion |
| Non-GAAP diluted EPS | first quarter of fiscal 2027 | $38.15 ± $1.00 |
| Tax rate | fiscal Q1 and fiscal 2027 | around 15.5 percent |
| Net capital expenditures | fiscal Q1 2027 | around $11.5 billion |
| Net capital expenditures | first half of fiscal 2027 | approximately $25 billion |
| Increase in operating expenses | fiscal 2027 | approximately $2.5 billion |
Fiscal Q4 revenue was $54.23 billion with non-GAAP gross margin of 87.0%, driven by DRAM prices up in the high-teens percentage range and NAND prices up approximately 30% sequentially.
Micron has signed 26 SCAs, estimated at over 35 % of revenue through 2030, with financial commitments from customers of $32 billion and remaining performance obligations of approximately $150 billion.
Guidance is approximately 86.25% non-GAAP gross margin, with roughly $1 billion of higher costs from incentive compensation, startup costs and other items. Management expects higher margins for the rest of fiscal 2027.
Fiscal Q1 capex is projected around $11.5 billion and first-half fiscal 2027 capex approximately $25 billion, with the second half higher and construction growing faster than equipment.
Cash and investments reached $73.5 billion with a net cash balance of $68.3 billion. Management plans to increase capital return from December 9, 2026 and expects to return 100 % of excess cash over time.
Fourth quarter worked out from the annual figure.
| Q1 FY25 | $8.7B |
| Q2 FY25 | $8.1B |
| Q3 FY25 | $9.3B |
| Q4 FY25 | $11.3B * |
| Q1 FY26 | $13.6B |
| Q2 FY26 | $23.9B |
| Q3 FY26 | $41.5B |
| Q4 FY26 | $54.2B * |
| Q1 FY25 | $1.67 |
| Q2 FY25 | $1.41 |
| Q3 FY25 | $1.68 |
| Q1 FY26 | $4.60 |
| Q2 FY26 | $12.07 |
| Q3 FY26 | $24.67 |
Fourth-quarter EPS appears once the press release is read; filings report it only for the full year.
| Q1 FY25 | 25.0% |
| Q2 FY25 | 22.0% |
| Q3 FY25 | 23.3% |
| Q4 FY25 | 32.3% |
| Q1 FY26 | 45.0% |
| Q2 FY26 | 67.6% |
| Q3 FY26 | 80.4% |
| Q4 FY26 | 80.7% |
| Q1 FY25 | $38.0M |
| Q2 FY25 | -$113.0M |
| Q3 FY25 | $1.7B |
| Q4 FY25 | $72.0M |
| Q1 FY26 | $3.0B |
| Q2 FY26 | $5.5B |
| Q3 FY26 | $17.6B |
| Q4 FY26 | $32.9B |
Operating cash flow minus capital expenditure, from cash flow statements.
Each quote matches the transcript word for word.
“To date, we have signed 26 SCAs, which we currently estimate to be over 35 % of our revenue through 2030.”
It sizes how much of future revenue is covered by multi-year take-or-pay contracts.
“I'll tell you that 2027, more than 75 % of our output is already committed for 2027.”
It shows how much of next year's supply is already spoken for.
“Even with additional industry DRAM clean room space plans, with robust demand trends including new upside requests from customers, we do not have line of sight to when supply and demand will return to balance.”
It captures management's view that tight supply could last well beyond 2028.
“We anticipate Fiscal Q1 to be the floor for gross margins in Fiscal 2027.”
It sets the margin trajectory for the coming year despite higher costs.
“Over time, we expect to return 100 % of our excess cash to shareholders.”
It signals a major shift toward capital returns as the balance sheet strengthens.
“For the 26 signed SCAs and extensions, financial commitments from customers have increased to $32 billion, the vast majority of which are cash deposits.”
It shows customers are backing long-term demand with cash.
Mark Murphy said Micron expects to reach target cash around the end of fiscal Q1, will increase capital return from December 9 mainly through buybacks, and will seek authorization beyond the current $2.2 billion. — Mark Murphy
Murphy said intensity is low versus history, spending is shifting toward construction, and capacity will be added in a disciplined way with adequate returns. — Mark Murphy
Murphy said incentive compensation, startup costs and other items add roughly $1 billion of higher cost in fiscal Q1, and Q1 should be the gross margin floor for the year. — Mark Murphy
Mehrotra said much of 2027 HBM volume is sold out at prices well above 2026, narrowing the margin gap with conventional DRAM, and HBM demand should outgrow DRAM. — Sanjay Mehrotra
Murphy said Micron has the ability and intent to increase capital return from December 9 and will seek a larger buyback authorization. — Mark Murphy
Mehrotra said 2027 and 2028 look tighter than 2026, with more than 75 % of 2027 output committed and no line of sight to supply and demand balancing. — Sanjay Mehrotra
Mehrotra said HBM demand outpaces the industry in 2027 and 2028, and customer optimizations do not remove the underlying need for more memory. — Sanjay Mehrotra
Murphy said the construction-heavy mix reflects the supply-demand imbalance and the lead time to build greenfield capacity, with fabs equipped as demand warrants. — Mark Murphy
Mehrotra said SCAs could still reach around 50 % of revenue through 2030, and the 75 % 2027 commitment covers both SCA and non-SCA customers. — Sanjay Mehrotra
Mehrotra said NAND investment within capex is increasing, including the new Singapore NAND fab, as data center SSD revenue reached $10 billion. — Sanjay Mehrotra
Revenue was $54.23 billion versus $11.32 billion a year earlier, with GAAP diluted EPS of $32.87 and non-GAAP diluted EPS of $33.42. Non-GAAP gross margin was 87.0% and operating cash flow was $43.97 billion.
Micron guided to revenue of $61.5 billion ± $1.5 billion, non-GAAP gross margin of approximately 86.25%, operating expenses of approximately $2.06 billion and non-GAAP EPS of $38.15 ± $1.00.
They are multi-year take-or-pay agreements; Micron has signed 26, estimated at over 35 % of revenue through 2030. Customers have committed $32 billion, mostly cash deposits.
Yes. Micron plans higher fiscal 2027 capex than prior plans, with around $11.5 billion in fiscal Q1 and approximately $25 billion in the first half, mostly adding construction for cleanroom space.
Micron ended the year with cash, marketable investments, and restricted cash of $73.48 billion and a net cash balance of $68.3 billion. It declared a $0.15 quarterly dividend and plans to increase capital return from December 9, 2026.
Call recording on YouTube ↗. Official replay ↗. Timestamps jump to the moment.
We'll now hand the conference over to Satya Kumar, Corporate Vice President, Investor Relations and Treasury. Satya, please go ahead.
Thank you, and welcome to Micron Technology' Fiscal Fourth Quarter 2026 Financial Conference Call. On the call with me today are Sanjay Mehrotra, our Chairman and CEO, and Mark Murphy, our CFO. Today's call is being webcast from our Investor Relations site at investors .micron .com, including audio and slides. In addition, the press release detailing our quarterly results has been posted on the website, along with prepared remarks for this call.
Today's discussion contains forward-looking statements that are subject to risks and uncertainties. These forward-looking statements include statements regarding our future financial and operating performance and our business model, as well as trends and expectations in our business, customers, market, industry, products, and regulatory and other matters. These statements are based on our current assumptions and we assume no obligation to update these statements. Please refer to our most recent financial reports on Form 10 , Forms 10 , and our other filings with the SEC for more information on the risks and uncertainties that could cause actual results to differ materially from expectations.
Today's discussion of financial results is presented on a non-GAAP financial basis unless otherwise specified. The reconciliation of GAAP to non-GAAP financial measures can be found on our website. I'll now turn the call over to Sanjay. Sanjay Mehrotra
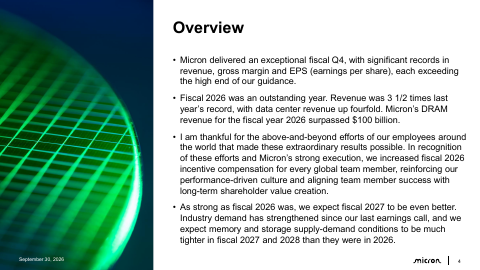
Thank you, Satya. Micron delivered an exceptional fiscal Q4 with significant records in revenue, gross margin, and EPS, each exceeding the high end of our guidance. Fiscal 2026 was an outstanding year. Revenue was three and a half times last year's record, with data center revenue up fourfold.
Micron's DRAM revenue for the fiscal year 2026 surpassed $100 billion. I'm thankful for the above and beyond efforts of our employees around the world that made these extraordinary results possible. In recognition of these efforts and Micron's strong execution, we increased fiscal 2026 incentive compensation for every global team member, reinforcing our performance-driven culture and aligning team member success with long-term shareholder value creation. As strong as fiscal 2026 was, we expect fiscal 2027 to be even better.
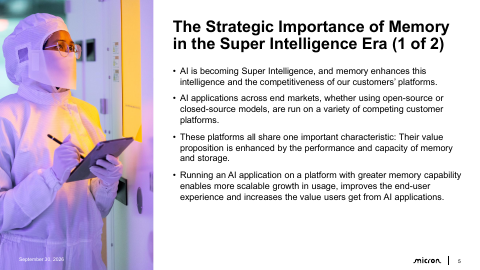
Industry demand has strengthened since our last earnings call, and we expect memory and storage supply demand conditions to be much tighter in fiscal 2027 and 2028 than they were in 2026. AI is becoming superintelligence and memory enhances this intelligence and the competitiveness of our customers' platforms. AI applications across end markets, whether using open source or closed source models, are run on a variety of competing customer platforms. These platforms all share one important characteristic. Their value proposition is enhanced by the performance and capacity of memory and storage.
Running an AI application on a platform with greater memory capability enables more scalable growth in usage, improves the end user experience, and increases the value users get from AI applications. The strategic importance of memory to our customers also provides greater differentiation opportunities for Micron than at any time in our history. As we address AI-driven demand for an increasingly complex set of products across the memory hierarchy, we have opportunities to deliver differentiated performance and quality, time to market advantages, and geographically diversified supply, including DRAM made in the U .S.
We also have opportunities for richer product mix relative to our competitors with our focus on higher value solutions. Micron's technology leadership, strong product portfolio, strategic customer agreements, and manufacturing excellence position us to capitalize on these opportunities. Micron is the industry's technology leader. Our OneGamma DRAM node and G9 NAND nodes are our largest production nodes today and are on track to become the highest volume nodes in Micron's history. Development of our next generation DRAM and NAND technology nodes is also progressing well and they are on track to begin volume production in the second half of calendar 2027.
We are leveraging these technology nodes and our advanced packaging capabilities to deliver leadership products across the memory hierarchy, such as industry-leading HBM, high-capacity SOCAMM, high-capacity and high-performance DDR modules, and data center SSD products. We are focused on our global manufacturing expansions to help address customer demand growth through the end of this decade and beyond. Micron is investing to provide long-term US-based supply assurance for DDR, LPD-RAM, and HBM products through our fabs in Virginia, Idaho, and New York to support our customers across a variety of markets including data center, PC, mobile, automotive, aerospace and defense, medical, humanoid robotics and other industrial and consumer markets.
During the last quarter, we celebrated a concrete pour milestone for our first New York fab with initial wafer output expected in calendar 2030. Our ID 1 fab is on track to commence wafer output in mid-calendar 2027, and ID 2 is on track to commence wafer output in late calendar 2028. In fiscal Q4, we held a groundbreaking ceremony for our DRAM fab expansion in Japan, with initial output expected in late calendar 2028 to support technology node transitions.
In Taiwan, we are on track for meaningful product shipments from our Tongluo facility in mid-calendar 2027. In Singapore, clean room preparation is ahead of plan at our HBM Advanced Packaging Facility, with initial output expected in early calendar 2027. Also construction is on track for our new NAND facility in Singapore to begin output in the second half of calendar 2028. production from new DRAM and NAND fabrication facilities takes time to ramp and gradually becomes more meaningful starting a few quarters after initial output.
Micron's strategic customer agreements accelerate the transformation of our business. These multi-year take or pay agreements sharpen our long-term supply planning and enhance the durability and predictability of our strong financial performance. Further, they provide our customers supply assurance and deepen technology roadmap collaboration. This, in turn, helps our customers invest more confidently in their business and enables their end consumers to benefit from their products and services. To date, we have signed 26 SCAs, which we currently estimate to be over 35 % of our revenue through 2030.
Three quarters of this estimated revenue has a defined pricing framework, a majority of which have pricing bands with floor and ceiling prices. The remaining quarter of this SCA revenue expectation has pricing negotiated periodically based on market prices. Customers want SCA-assured supply beyond 2030, and we have now signed SCAs that extend into 2031 as well as one-year extensions to 2031 for two agreements. Any new discussions on SCAs where pricing is involved are negotiated with higher pricing based on prevailing market conditions and outlook.
For the 26 signed SCAs and extensions, financial commitments from customers have increased to $32 billion, the vast majority of which are cash deposits. These financial commitments reflect our customers' confidence in their long-term demand for memory and storage. Turning to our end markets, please see our earnings press release for highlights across our high capacity DDR and LP server DRAM, data center SSD, PC, smartphone, and physical AI product portfolios. We expect server unit growth in the high teens percentage range in both calendar year 2026 and 2027.
This strong server unit growth is supported by a modestly lower rate of content growth than prior expectations amid tight memory supply. Growing model parameter size, longer context lengths, and higher concurrency continue to increase the memory and storage content required to execute AI workloads efficiently. Micron is leveraging our technology leadership and manufacturing excellence to deliver innovative products across the memory hierarchy to data center customers. In HBM, our revenue for fiscal Q4, 2026 grew faster than total company revenue in the quarter as we ramped HBM shipments across a growing number of customers.
We have completed agreements for the vast majority of our calendar 2027 HBM bid supply with significant price increases year over year, narrowing the gross margin gap with conventional DRAM. We continue to execute well on our ramp of HBM4. We have a strong roadmap for future HBM products and are proud to be working with NVIDIA on the industry's first custom HBM4E implementation, NVHBM, to be adopted on next generation of GPUs and NVLink fusion platforms. In NAND, AI context memory storage used for KVCache offload and HDD displacement opportunities are expanding the addressable market for SSDs.
Data Center SSD revenue in fiscal Q4 was nearly $10 billion, more than 10 times the year-ago quarter and was over two-thirds of total company NAND revenue. We are on track to deliver the fifth consecutive year of record market share in Data Center SSD in calendar 2026. This performance is driven by the strength of our NAND technology leadership, end-to-end data center storage portfolio and close collaboration with customers which has resulted in design wins across the largest data center deployments.
PC and mobile industry revenue remain on track to grow this calendar year, driven by strength at the premium end of the market despite potential double-digit overall unit declines in both markets. OEMs continue to introduce new AI capabilities in flagship PCs and smartphones, driving robust demand for higher performance devices with increased DRAM and NAND content. Micron is focused on these premium segments and is well positioned to support customers as they expand edge AI capabilities with our industry-leading memory and storage portfolio.
Nearly half of MCBU revenue in fiscal Q4 was generated by OneGamma products as customers accelerate qualifications and adopt our latest technology, which delivers lower power consumption and higher performance. Autonomous vehicles are the first major deployment of physical AI, which we believe will expand over time to humanoid robots and other intelligent autonomous systems. These increasingly complex systems require substantially higher performance and more power-efficient memory and storage to operate in real time. Memory content in level 4 and higher autonomous vehicles typically exceeds 200 GB, while storage content reaches multiple terabytes, each more than an order of magnitude greater than in today's level 2 plus and level 3 semi-autonomous vehicles.
Humanoid robots are expected to have comparable memory and storage requirements to autonomous vehicles. With the anticipated increase in both units and memory content, physical AI can become a significant driver of memory and storage demand by the end of this decade. Several physical AI customers are sampling our next generation products and we are increasing investments in our technology roadmap to ensure we are prepared to capitalize on this opportunity. Now turning to market outlook. We expect memory and storage supply demand conditions to be much tighter in calendar 2027 and 2028 than they were in 2026.
In NAND, for calendar 2026, we expect industry bid shipments to grow in the low 20s percentage range, slightly above our prior expectations. We expect micron NAND supply to grow less than industry supply growth in calendar 2026. For calendar 2027 and 2028, we expect industry NAND bid shipments to grow approximately in the mid-20s percentage range and the industry to remain supply constrained in both years. In DLAM, for calendar 2026, we expect industry bid shipments to grow in the mid-20s percentage range.
We expect micron DRAM supply to grow approximately in line with industry supply growth. For calendar 2027 and 2028, we expect industry DRAM bid shipments to grow approximately in the low 20s percentage range and the industry to remain supply constrained in both years. We expect industry HBM bid shipments to grow faster than conventional DRAM through calendar 2028. The structural gap between DRAM supply and demand growth rates is resulting in ongoing supply tightness and clean room additions are required to augment node transition supply growth and help narrow the gap.
Even with additional industry DRAM clean room space plans, with robust demand trends including new upside requests from customers, we do not have line of sight to when supply and demand will return to balance. Given the need for DRAM cleanroom space and supported by greater visibility from SCAs into our demand through the end of the decade and beyond, we plan to increase our capex in fiscal 2027 versus prior plans. A majority of the increase is for construction capex, most of which is to help accelerate cleanroom space availability in late calendar 2028 and beyond.
We are also working to optimize production from available clean room space, which is resulting in some pull forward of equipment spending. Mark will provide more details on CapEx. As we make these clean room space investments, we will remain disciplined in our approach and anticipate ramping equipment capacity appropriately with our demand in the market environment. To further accelerate execution and innovation across the company, last month we announced leadership appointments. Manish Bhatia has been appointed to President and Chief Operating Officer and Scott DeBoer has been appointed to President and Chief Technology and Products Officer.
Manish leads Micron's business units and global operations with accountability for our operating P &L. In his role as COO, Manish has end-to-end responsibility for demand through supply, enabling faster, more integrated decision-making and stronger alignment across the organization to meet our customers' evolving needs. Scott leads Micron's innovation, technology, and products organization. In his role as chief technology and products officer, SCART is responsible for advancing Micron's industry-leading memory and storage roadmaps, accelerating innovation to meet customers' rapidly evolving requirements, and overseeing Micron Research Labs, a global flagship research hub dedicated to breakthrough memory and compute technologies.
I'll now hand it over to Mark for our fiscal Q4 financial results and outlook.
Thank you, Sanjay, and good afternoon, everyone. Micron delivered exceptional results to close out the fiscal year, with fiscal Q4 revenue, gross margin, and EPS all exceeding the high end of our guidance. For the full year, we achieved record revenue of $133.2 billion, dollars, up 256% year-over-year. Fiscal 2026 gross margins expanded to 81.1 percent, a 40 percentage point improvement from fiscal 2025, and EPS increased 811% year-over-year to $75.52.
To date, we have signed 26 SCAs in total, and our remaining performance obligations or RPO is approximately $150 billion. All SCAs have take or pay contracted volumes. An RPO reflects the contract value for only SCAs that have a determined pricing framework, which can be either a fixed price or subject to a pricing floor and ceiling. RPO is based on committed volumes and minimum pricing and is inherently conservative. As mentioned in our last earnings call, even at floor prices, we expect margins meaningfully above any prior cycle peak margins.
We expect revenue to well exceed the associated RPO over the terms of the agreements. Consolidated fiscal Q4 revenue was $54.2 billion, up 31 % sequentially and up 379 % year-over-year. Fiscal Q4 revenue was our sixth consecutive quarterly revenue record. Fiscal Q4 DRAM revenue was a record $39.8 billion, up 343 % year-over-year, and represented 73 % of total revenue. Sequentially, DRAM revenue increased 27%. BIT shipments were up mid-single-digit percentage range.
Prices increased high-teens percentage range, driven by tight DRAM industry conditions. Fiscal Q4 NAND revenue was a record $14.1 billion, dollars, up 526% year-over-year and represented 26% of total revenue. Sequentially NAND revenue increased 42%. Bid shipments increased approximately 10%. Prices increased approximately 30%, driven by tight NAND industry conditions. Consolidated gross margin for fiscal Q4 was 87%, up 210 basis points sequentially. This improvement was driven primarily by higher pricing and strong execution, partially offset by mix.
Now turning to quarterly financial performance by business unit. Cloud memory business unit revenue was a record $16.3 billion and represented 30 % of total company revenue. CMBU revenue was up 18 % sequentially, driven by higher pricing and bit shipments. CMBU gross margins were 83%, flat sequentially, driven by higher pricing, offset by higher HBM mix. Core data center business unit revenue was a record $18 billion and represented 33 % of total company revenue. CDBU revenue was up 56 % sequentially, driven by higher pricing and bit shipments.
CDBU gross margins were 90%, up 290 basis points sequentially, driven by higher pricing and favorable mix. Mobile and client business unit revenue was a record $13.1 billion and represented 24 % of total company revenue. MCBU revenue was up 14 % sequentially, driven by higher pricing, partially offset by lower bit shipments. MCBU gross margins were 90%, up 260 basis points sequentially, driven primarily by higher pricing and favorable mix. Automotive and embedded business unit revenue was a record $6.8 billion and represented 13 % of total company revenue.
AEBU revenue was up 47 % sequentially, driven by higher pricing and higher bid shipments. AEBU gross margins were 84%, up 470 basis points sequentially, driven by higher pricing. Operating expenses in Fiscal Q4 were $2.6 billion, up $1.1 billion quarter over quarter. The sequential change was primarily due to the increase in incentive compensation for every global team member, along with our decisions to contribute $300 million to community investments. We generated operating income of $44.6 billion in fiscal Q4, resulting in an operating margin of 82.3%, up 110 basis points sequentially, and 47 percentage points year over year.
Fiscal Q4 taxes were $6.8 billion on an effective tax rate of 15%. Non-GAAP diluted earnings per share in fiscal Q4 was $33.42, up 33 % sequentially. Turning to cash flow and capital expenditures, in fiscal Q4, operating cash flows were $44 billion. dollars. Capital expenditures were 10.8 $1 billion, resulting in free cash flow of 33.2 $1 billion. As noted in previous disclosures, customer cash deposits associated with SCAs are reported within financing activities and therefore do not affect our free cash flow.
Customer cash deposits received during Fiscal Q4 were $12.3 billion. Ending inventory for Fiscal Q4 was $10.4 billion, with days of inventory at 129, an increase of nine days sequentially. The increase in DIO includes the effect of no end-of-life related build-ahead and manufacturing manufacturing-related incentive compensation in Fiscal Q4 that was absorbed into inventories. Our inventory levels and supply remain extremely tight, and we expect DIO to decline in the coming quarters. We reached record levels of cash and investments of $73.5 billion at quarter end.
Customer cash deposits on our balance sheet at the end of fiscal Q4 were $12.7 billion. SCA cash deposits are unrestricted and will be returned to customers over time, towards the latter half of each agreement's term, assuming minimum purchase requirements are met. During fiscal Q4, we reduced debt by approximately $500 million, dollars, including a note redemption that reduced senior notes by approximately $300 million. The weighted average maturity on our outstanding debt is approximately nine years.
We closed the quarter with 5.2 $1 billion of debt and a net cash balance of 68.3 $1 billion. During the quarter, we received two credit rating agency upgrades and are now rated at BBB plus or equivalent with all three major credit rating agencies. Our balance sheet has never been stronger, and we expect it to strengthen further even as we increase investment in technology and needed capacity. As noted previously, we intend to increase our capital return from December 9, 2026, the second anniversary of the signature of our definitive CHIPS agreements.
Over time, we expect to return 100 % of our excess cash to shareholders. Now turning to guidance. We expect fiscal Q1 revenue to be a record $61.5 billion, dollars plus or minus 1.5 $1 billion gross margin to be approximately 86.25 percent and operating expenses to be approximately 2.06 $1 billion based on a share count of approximately 1.15 billion shares we expect eps to be 38.15 cents per share, plus or minus a dollar.
We expect fiscal 2027 to be another record year with sequential revenue growth each quarter. Consistent with projected strong execution and record company financial performance, we expect fiscal 2027 to have higher incentive compensation levels. We anticipate Fiscal Q1 to be the floor for gross margins in Fiscal 2027. As Sanjay mentioned, we made a decision to increase Fiscal 2026 incentive compensation in Fiscal Q4. Most of the increase in Fiscal 2026 incentive compensation pertaining to manufacturing was absorbed into inventories in Fiscal Q4.
As a result, the effects from the sale of these higher cost inventories principally impact Fiscal Q1 gross margin. Fiscal Q2 benefits from less of this Fiscal Q4 related compensation expense, but this benefit is offset by the impact of higher Fiscal 2027 incentive compensation. We expect higher gross margins beyond fiscal Q1 for the remainder of fiscal 2027, with a more moderate rate of price increases. We project operating expenses to increase by approximately $2.5 billion in fiscal 2027, primarily from higher R &D to support an unprecedented set of opportunities in memory and storage and from higher incentive compensation plans.
We expect a fiscal Q1 and fiscal 2027 tax rate of around 15.5 percent. Micron continues to invest in a disciplined manner across our global footprint to address customer demand. As a reminder, our CAPEX is net of anticipated government incentives. In fiscal Q1, we project CAPEX of around $11.5 billion and anticipate first half fiscal 2027 CAPEX to be approximately $25 billion. We project CAPEX to be higher in the second half of fiscal 2027. We expect a meaningfully higher growth rate in construction CAPEX as compared to equipment CAPEX in fiscal 2027.
Before I close, I would also like to add my thanks to all Micron Global Team members for their focus on technology and product innovation and discipline and execution that makes these strong results and outlook possible. I'll now turn it over to Sanjay to close.
Thank you, Mark. Superintelligence is creating the most compelling opportunity for Micron in its history. Fiscal 2026 was an outstanding year, and we expect fiscal 2027 to be even better. As we celebrate the 48th anniversary of Micron's founding, I would like to acknowledge the nearly five decades of innovation, disciplined execution, and perseverance that have prepared Micron for this moment.
We will now open for questions.
We will now begin the question and answer session. Please limit yourself to one question and one follow-up. If you would like to ask a question, please press star 1 to raise your hand. To withdraw your question, press star 1 again. We ask that you pick up your handset when asking a question to allow for optimal sound quality. If you are muted locally, please remember to unmute your device. Please stand by while we compile the Q &A roster.
Your first question comes from the line of Timothy Arcuri from UBS Securities, LLC. Your line is now open. Please go ahead.
Thanks a lot. Mark, I wanted to ask about capital return. I know you don't want to front run yourself, but can you give us any mileposts here? Like, what are you thinking of minimum cash balance? You have pretty much double the cash that Apple or NVIDIA have. So sort of what's enough cash? Do you think, you know, do you want to keep $100 billion in cash and you're worth everything beyond that?
Can you give us, I know you don't want to front run yourself, but can you give us some sense of what the mileposts are?
Sure, Tim. I'm happy to provide some perspective. Yeah, the market conditions, Micron's technology and product position and operational execution, you know, all combined to deliver very strong free cash flow. We had $33 billion as reported here in fiscal Q4. We expect that strong free cash flow growth to continue on the market conditions and discipline and execution, even while we invest in more R &D and capex, as you heard today.
So with these demand drivers and supply factors and long-term and committed agreements that you heard about today, plus Micron's technology position and execution, we think this free cash flow strength is more durable. So near term, based on our Q1 guide and including the CAPEX number that you heard, you will see free cash flow is significantly higher than the $33 billion we reported in fiscal Q4. On target cash, we expect to be around a target cash level by the end of fiscal Q1.
Now, over time and with the rate and pace determined by various factors, we plan to return excess primarily done through share repurchase. We intend to increase capital return as we've talked about before and in the script today from December 9th. And then finally, I'll just add that our current authorization that you can see from our previous filings for share repurchase stands at $2.2 billion. And you can assume that we will seek additional authorization in the near term on more authorization.
Thanks a lot for that, Mark. And then just a follow-up. So CapEx, you're not guiding the full year, but it sounds like maybe it's going to be 55, maybe a little higher this year, which seems like it's making the high teens as a percent of revenue for fiscal 27. I know that the revenue is a lot higher, so it's going to take time for the CapEx to kind of catch up. But how do we think about capital intensity over the longer term for the business?
I know you used to talk about mid-30s. That seems a little high, probably given what's going on now. But is like 20 to 25 a new norm? Can you kind of walk us through that? Thanks.
Yeah, Tim, I would just comment that you capture correctly. that, you know, we gave you a first half CapEx number, we indicated the second half would be higher. Importantly, that mix of capital spend is shifting to more construction, and we gave you some commentary on that versus equipment.
And, you know, we would expect that trend to continue here next few years. Now, you know, as it relates to capital intensity, I think, as you point out, that capital intensity is low on historic levels and that is reflective of, you know, the strategic asset that memory and storage has become. And, you know, the industry is structurally reset and we will continue to work to, you know, add capacity in a very disciplined manner, ensuring that we're getting adequate return on that capacity investment going forward.
Okay, thank you.
Your next question comes from the line of CJ Mews at Cantor Fitzgerald. Your line is now open. Please go ahead.
Yeah, good afternoon. Thank you for taking the question. I guess first question on gross margins. Within the guide for November, can you quantify the impact from the higher ASP inventory and are there other sort of mixed shifts that we should be thinking about that are impacting the sequential?
Yeah, CJ, I will—this is Mark—I will take this opportunity to just provide a bit more perspective on Fiscal Q4 and Fiscal Q1 to help walk you through, you know, the puts and takes on margin.
You know, in Fiscal Q4, we made the decision to increase incentive compensation, And you can see that most clearly in actually the OPEX number. And you can see it clearly in the third quarter to fourth quarter OPEX. Now, in manufacturing expense, most of these costs, they're absorbed into inventories in Q4. So there was only a small effect in Q4. But the higher cost inventories as a result of the increase in incentive comp booked in the fourth quarter, the impact of that you'll see in the fiscal Q1 guide.
And we also have some startup costs, which I've talked about previously, and some other costs. But incentive comp is the big driver to that gross margin outlook. And in total, these factors in the first quarter are roughly $1 billion of higher cost in Q1. So that gives you a sense of the margin impact. Now, I think it's important to note that we also have significantly increased fiscal 27 incentive compensation. And you see the effect of that in first quarter, again, in the OPEX number, in the Fiscal Q1 OPEX guide.
On manufacturing, most of the higher FY27 incentive comp will start to impact margins in Fiscal Q2. Now, beyond the normal cost increases from higher volume and depreciation, you have this roughly $1 billion of ongoing costs from incentive comp, higher startup, and some other costs in fiscal 27. So, you know, while it's a headwind in the first quarter and there are some sustained costs through the year, it's important to keep in mind how structurally different the business is as far as profitability and return.
We're operating at a much stronger level. And I've talked about how 27, 28, we expect to be stronger market conditions in 26. and long-term agreements give us, you know, take and take or pay agreements give us visibility beyond that. And I think it's important also note that these costs, you know, these, some of these costs can be considered variable or temporal. So for 27, we also discussed how we expect Q1 to be the floor and gross margin, and we expect higher gross margin for the balance of the year as we have continued price increases and strong operating performance.
Very helpful. I guess as a follow-up, could you speak to, I guess, HBM? and you talked about raising pricing to be closer to conventional DRAM. Should we assume that that's a Jan 1st increase? And how should we think about the relative growth of that business overall? Is there sort of a percentage that you're comfortable sharing? Thanks so much.
So I can take that question, CJ. So as you know, for 2026, our prices for HBM were negotiated with our customers last year.
And we mentioned that now for 2027, a large part of the volume is already sold out for 2027 for HBM. And the prices are much higher than 2026 prices. And, you know, of course, that is helping us narrow the margin gap with the non-HBM memory there. So overall, our HBM is on a very good trajectory. We indicated that overall for the industry, we expect HBM to be outgrowing the DRAM in terms of the demand growth.
So HBM is on a strong trajectory. Our portfolio is very well positioned. You know, our HBM 3E, HBM 4 products late next year with HBM 4E products. So we continue to see strong momentum with our HVM products and well positioned to address the opportunities ahead. So I hope I answered your question regarding the growth here, strong growth, strong products, and with the price increases starting in calendar year 2027, narrowing the margin gap with non-HVM part of the dealer market.
Very helpful.
Your next question comes from the line of Vivek Arya from Bank of America Security. Your line is now open. Please go ahead.
Thanks for taking my questions. For the first one, Mark, I wanted to go back to cash returns. At this space, Micron could generate over 100 billion, I think from Q2 to Q4. So even if, let's say Q1, you're building cash to get your target balance sheet, your So cash generation from Q2 onward should get you to at least 100 plus billion.
So if that is the case, why shouldn't we expect that level of cash return in fiscal 27? So I know you're not providing a specific number, but what am I missing in that high level analysis, right beyond just going through the outline of sales and margins and capex estimates that you're providing?
Yeah, Vivek, all I can add is that, and hopefully made it clear in the prior response, that we have the ability and the intent to increase our capital return.
And you can expect us to seek to increase our authorization and commence stronger capital return from December 9th in accordance with the agreements we have on CHIPS.
For my follow-up, maybe one for Sanjay. When we look, Sanjay, at the evaluation of memory stocks, right, very depressed, which suggests that people feel that next year might be a peak for pricing, might be a peak for earnings in this cycle, either because the industry is bringing on incremental capacity or there is a narrative that maybe some of your customers, even in the data center, might despec products either because of shortages of memory or just because it's such a bigger part of the material.
So I know you don't talk about specific pricing, but as you were to think about conceptually in 2028 for the industry, what is the potential for industry pricing to continue to stay favorable to even potentially increase versus 27, given these headwinds from either incremental capacity coming online or some customers wanting to despec their products to cope with market conditions?
So as we noted, in calendar 27 as well as 2028, we see demand exceeding supply. And in fact, we see greater tightness in the industry in 27 and in 28 versus 26.
So overall, supply-demand environment is only getting tighter. And, of course, even as we work hard to bring up capacity, as I shared in my prepared remarks, even with any new clean room space coming up in 2028, we see continuing tight supply conditions because, first of all, clean rooms take a long while to build. even after they are built, even after first wafer output. Production ramps up only gradually in the clean rooms. That's just the nature of what it takes to bring up production.
And, you know, with HBM going from 3E to a greater mix of 4 and 4E, and with the trade ratio that exists, that again creates headwinds with respect to supply growth. Nodes' transitions of the future give less productivity gain per wave core as well. So there are a lot of factors, these key factors that are, you know, headwinds to the supply growth and even in 2028, even as some of the new clean rooms start ramping up, the supply is tight.
And that is in the backdrop of strong demand. While some level of content growth may be moderately lower in some of the servers compared to prior expectations, overall unit demand for servers continues to increase. 26 as well as 27, we expect, you know, high teens in terms of server unit shipments, and that sets the stage well for data center growth of shipments for DRAM in 2028 as well. So it's a strong demand environment, and customers work with, you know, they fully understand this extremely tight supply outlook that we have.
We have shared with you that we do not see line of sight when supply catches up with demand because the demand trends of larger models, growing context, more currency, greater agents across enterprise and consumer only continue to drive greater need for memory, greater need for memory content, as well as for higher performance memory. So when customers reduce their content growth versus prior expectation, as I refer to in certain platforms, that really is to enable them to ship more units as reflected in the strong server growth in 26 as well as 27, which sets the stage up well for 2028 timeframe.
So I see a healthy demand supply environment here, you know, going forward for the factors related to demand as well as for supply. And that obviously bodes well for the industry pricing environment as well. And I'll just add here that our SCAs give us tremendous visibility with our customers. And we mentioned here that our customers are actually coming to us, you know, asking for more supply. SCA customers are asking for more supply. Non-SCA customers, I mean, we are getting POs.
I'll tell you that 2027, more than 75 % of our output is already committed for 2027. and a majority of discussions with our customers today are already around 2028. So overall, the industry demand supply environment and the outlook is in a very healthy place here, and we do not have, in this strong demand environment, we do not have line of sight to when supply and demand will get in balance. And customers want assurance now even beyond 2030 timeframe.
I mean, we mentioned that we concluded some extensions to our SCAs as well as the 2031 timeframe as well as new SCAs for extending out to 2031 timeframe.
Our next question comes from the line of Krish Sankar from TD Cowan. Your line is now open. Please go ahead.
Yeah, hi. Thanks for taking my question. I had to add to Sanjay, you know, there's been talk of way one large customer de-spec-ing HBM. I'm kind of curious what your view on that is and also implications given the fact that HBM has higher trade ratio.
If those wafers get reallocated to DDR, would it increase DDR supply quite a bit? And then add a follow-up.
So as you mentioned, we actually see the overall HBM supply, I mean HBM demand outpacing the industry demand in 27 as well as in 28. And we continue to see, you know, tight memory conditions in both 27 and 28 timeframe. And, you know, the latent nature of a need for more memory in the applications continues to be strong because, you know, AI platforms, in order to deliver their maximum capabilities and potential just need more and faster memory to, again, address the growing context, concurrency, and, of course, the larger model sizes as well.
So overall, the demand trends are in a very strong place. And then customers make optimizations. They make these optimizations mainly to be able to ship more units to drive their own more growth, as well as to address the end market opportunity of growing, scaling up AI. And these optimizations, when they occur, they do not take away from the latent nature of a need for more memory in the systems. And these optimizations also have a diminishing return for any further optimizations.
And if you contrast optimizations with actually the secular demand and the value proposition of memory in the platforms, you will see that the overall demand trend continues to be very healthy for memory and storage. And again, we see 27 and 28 tighter than 26.
Got it. That's very helpful, Sanjay.
And HVM continues to grow faster than conventional DRAM through 2028.
Got it. Thanks for that, Sanjay. And Mark, just a quick follow-up. I know clearly like FY27 CAPEX higher than 50 billion and looks like your free cash is going to be over 100 billion.
and higher growth rate in construction CAPEX, this is equipment. I'm just wondering, is that because you are constrained in getting semi-equipment next year, or is it not an issue? I'm just trying to wonder if there is a natural cap on CAPEX next year because you're constrained in securing the equipment.
Kersh, it's related to just the strong supply-demand imbalance that we have and the lead time it takes to get greenfield capacity in place. So that, we've talked through many fabs that we're building out and coming, you know, ID1, ID2, Japan, Singapore, Tonglo.
And so, and we've got now the visibility through these, you know, strategic customer agreements to build out this greenfield capacity. And then, you know, we will equip those fabs as appropriate, given our most current views on demand.
Thanks a lot, Mark. Very helpful.
Our next question comes from the line of Harlan Sir at JPMorgan. Your line is now open. Please go ahead.
Hey, good afternoon. Thanks for taking my question. Last earnings with 16 SCAs secured, your view was the potential for 50 % plus kind of SCA coverage on forward revenues given the pipeline of SCAs signed and under negotiation.
Fast forward to this quarter, 26 SCAs now secured under coverage, and you and your customers have an updated industry view that is even further supply constrained in calendar 27 and calendar 28. So what do you think your forward revenue coverage will be if all of your current SCA negotiations are completed? I think Sanjay, you said 70 % of revenue is covered in fiscal 27 by customer commits, including SCAs. But could the team actually see 60, 70 % SCA coverage on forward revenues over the next few years when all of your negotiations are completed?
So regarding my comment on 27, that more than 75 % of our output is already committed. As I had said, that is, of course, between the SCA customers as well as non-SCA customers. Keep in mind that we have certain large customers where we, of course, are doing business with them on an annual basis as well. So, you know, that volume coverage comment I just wanted to clarify, it is across our customer base, SCAs as well as non-SCAs.
And given the strong demand trends, you know, we are getting purchase orders for 2027 from non-SCA customers as well early on here. And regarding your question on where could SCAs ultimately reach to, so that basically is still around 50 % of our revenue through the 2030 timeframe that we had previously commented on. That comment still remains about the same, that we could reach around 50 % of our revenue to be covered by SCA. Of course, you know, that could be less too, depending upon the revenue of all the rest of the business, right?
So, but, you know, overall, that objective remains by and large the same. And of course, we are always managing the mix of the business. it is important for us to be able to maintain flexibility in terms of managing our supply across our customer base, across the end market segments, across new customers too that may be evolving over the course of the next few years, particularly given the dynamic nature of our industry, the tremendous amount of innovation that's just happening across the board.
We want to be in a position to basically remain in that position. So basically, I think, you know, we are really making very good progress in this regard. And the benefit of SCA is to give us visibility into the demand out there in the future. It really helps us plan our investments. And that really is a fundamental change to the nature of this industry. when you think about it, that it helps us manage our investments, manage our supply expectations with a long lead time, a long time horizon.
That is really good for the health of the industry versus the past when you would experience more volatility in our industry.
Oh, I appreciate that. And then on the NAND side of the business, you know, relative to your competitors in that, and the Micron teams, I think total bit supply share puts you sort of in that number four, number five sort of global market share regime, right? Yet the team continues to drive this very, very strong, like number two market leadership position in data center and enterprise SSD.
Strong performance differentiation is required here, right? It's not just you've got this great base G9 technology, but it's also the controller technology, firmware, customization. You're also a part of the NVIDIA SCADA initiative for direct GPU access to storage. And it seems like more and more of the inferencing related KV cache functionality is being offloaded to storage, right? And so with the expansion of memory curing to include more and more flash based architectures, like has that changed the team's view on your R &D and CapEx investments in your NAND franchise?
So, you know, certainly, as you noted, the memory hierarchy from HBM to DRAM to SSD, I mean, it continues to be leveraged as context windows grow and as AI advances. And we are very pleased with our product portfolio position. And as we noted, I mean, our portfolio is in the best position ever in the industry, particularly to capture these huge growing market opportunities with AI. And of course, very proud of our team's strong execution on the side of SSD, which is critical for data center SSDs, which are absolutely critical in the memory hierarchy that is needed to drive the growth of AI.
And you are seeing the results of that, you know, five consecutive years now of shared growth in the data center market, you know, our revenue reaching $10 billion in fiscal Q4 for data center SSD, data center SSD becoming two-thirds of our total NAND revenue. So we are, of course, you know, continuing to invest in R &D, you know, related to the products, as well as making the investments on the manufacturing side. Our investments related to NAND as part of our overall CapEx, you know, certainly are increasing as well.
And, you know, we are, as you know, we have talked about the next fab for NAND that we are also building in Singapore, which is currently on track for late calendar 2028 timeframe. And our CapEx is supporting our G9 NAND tech transition, of course driving toward equipment productivity optimization, NAND R &D, you know, and other aspects of our Singapore operations as well.
Thank you, Sanjay. This concludes the Q &A session and today's call. Thank you for attending.
You may now disconnect.