
Micron (MU) · Semiconductors
Micron Q3 FY2026 earnings: summary, key numbers & outlook
Results filed 24 Jun 2026 · Quarter ended 28 May 2026
Slides (44 pages)Press release ↗Investor relations ↗
Summaries and transcripts are machine-generated and can contain errors.
In brief
Micron reported third-quarter fiscal 2026 revenue of $41.46 billion versus $23.86 billion for the prior quarter and $9.30 billion a year earlier, GAAP net income of $28.24 billion, or $24.67 per diluted share, and non-GAAP net income of $28.86 billion, or $25.11 per diluted share.
Micron had a record third quarter of fiscal 2026. Revenue was $41.46 billion, up from $23.86 billion in the prior quarter and $9.30 billion a year earlier. GAAP net income was $28.24 billion, or $24.67 per diluted share. GAAP gross margin was 84.6%. Operating cash flow was $25.39 billion, and adjusted free cash flow was $18.3 billion. All four business units grew revenue, led by Cloud Memory, Core Data Center, and Mobile and Client.
For the fourth quarter, Micron guides to revenue of $50.0 billion ± $1.0 billion, gross margin of approximately 86%, and non-GAAP diluted EPS of $31.00 ± $1.00. Management points to AI-driven memory demand and new multi-year Strategic Customer Agreements. The tension is that results are now extremely strong relative to a year ago, and receivables and capital spending are rising quickly. Micron is investing at record levels to meet demand.
Slides & documents
Open the slide deck (PDF, 44 pages) ↗

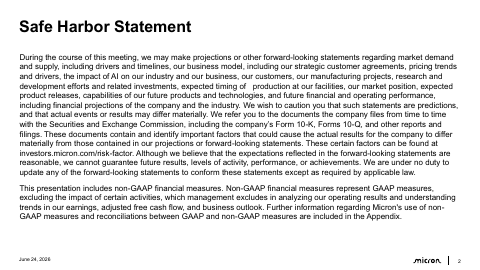

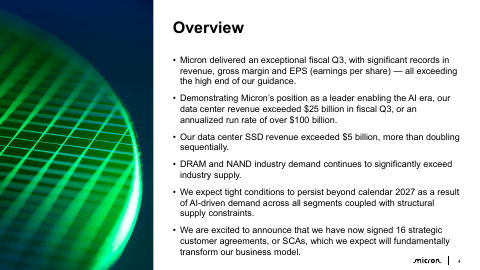

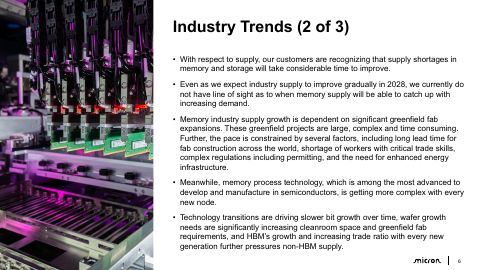
Showing the first 6 of 44 pages.
From Micron investor relations
SEC filing
Key numbers
- Revenue · GAAP
- $41.46 billion
- Net income · GAAP
- $28.24 billion
- Diluted EPS · GAAP
- $24.67
- Diluted EPS · non-GAAP
- $25.11
- Gross margin · GAAP
- 84.6%
- Operating income · GAAP
- $33.3B
- Operating margin · GAAP
- 80.4%
- Operating cash flow · GAAP
- $25.39 billion
versus $23.86 billion for the prior quarter and $9.30 billion for the same period last year
versus $11.90 billion for the prior quarter and $4.61 billion for the same period last year
| Segment or metric | Value | Change |
|---|---|---|
| Cloud Memory Business Unit revenue | $13,769 | versus $7,749 in the prior quarter and $3,386 a year ago |
| Core Data Center Business Unit revenue | $11,524 | versus $5,687 in the prior quarter and $1,530 a year ago |
| Mobile and Client Business Unit revenue | $11,521 | versus $7,711 in the prior quarter and $3,255 a year ago |
| Automotive and Embedded Business Unit revenue | $4,634 | versus $2,708 in the prior quarter and $1,127 a year ago |
Where each number comes from
- Revenue: “Revenue of $41.46 billion versus $23.86 billion for the prior quarter and $9.30 billion for the same period last year”
- Net income: “GAAP net income of $28.24 billion, or $24.67 per diluted share”
- Diluted EPS: “GAAP net income of $28.24 billion, or $24.67 per diluted share”
- Diluted EPS: “Non-GAAP net income of $28.86 billion, or $25.11 per diluted share”
- Gross margin: “Percent of revenue | 84.6% | 74.4% | 37.7% | 84.9% | 74.9% | 39.0%”
- Operating income: “Operating income | 33,318 | 16,135 | 2,169 | 55,589 | 6,116”
- Operating margin: “Percent of revenue | 80.4% | 67.6% | 23.3% | 81.2% | 69.0% | 26.8%”
- Operating cash flow: “Operating cash flow of $25.39 billion versus $11.90 billion for the prior quarter and $4.61 billion for the same period last year”
- Cloud Memory Business Unit revenue: “Cloud Memory Business Unit Revenue | $13,769 | $7,749 | $3,386 Gross margin | 83% | 74% | 58%”
- Core Data Center Business Unit revenue: “Core Data Center Business Unit Revenue | $11,524 | $5,687 | $1,530 Gross margin | 87% | 74% | 38%”
- Mobile and Client Business Unit revenue: “Mobile and Client Business Unit Revenue | $11,521 | $7,711 | $3,255 Gross margin | 87% | 79% | 24%”
- Automotive and Embedded Business Unit revenue: “Automotive and Embedded Business Unit Revenue | $4,634 | $2,708 | $1,127 Gross margin | 79% | 68% | 26%”
Copied from the press release ↗ and other documents in the SEC filing ↗. A figure is published only if its sentence is in the filing.
| From the filing | Q3 FY2026 | vs year ago | vs last quarter |
|---|---|---|---|
| Revenue | $41.5B | +345.7% | +73.7% |
| Operating income | $33.3B | +1436.1% | +106.5% |
| Net income | $28.2B | +1398.3% | +104.9% |
| Diluted EPS | $24.67 | +1368.5% | +104.4% |
| Free cash flow | $17.6B | +951.0% | +218.4% |
| Gross margin | 84.6% | +46.9 pts | +10.2 pts |
| Operating margin | 80.4% | +57.1 pts | +12.8 pts |
Calculated by code from XBRL, not by the model.
Outlook
| Metric | Period | Outlook |
|---|---|---|
| Revenue (GAAP and non-GAAP) | fourth quarter of 2026 | $50.0 billion ± $1.0 billion |
| Gross margin (GAAP and non-GAAP) | fourth quarter of 2026 | Approximately 86% |
| GAAP operating expenses | fourth quarter of 2026 | Approximately $1.86 billion |
| Non-GAAP operating expenses | fourth quarter of 2026 | Approximately $1.65 billion |
| GAAP diluted EPS | fourth quarter of 2026 | $30.73 ± $1.00 |
| Non-GAAP diluted EPS | fourth quarter of 2026 | $31.00 ± $1.00 |
Key takeaways
Revenue more than quadrupled from a year ago
Revenue was $41.46 billion versus $9.30 billion for the same period last year and $23.86 billion for the prior quarter.
Gross margin reached 84.6% on a GAAP basis
GAAP gross margin was 84.6% versus 74.4% in the prior quarter and 37.7% a year ago. Non-GAAP gross margin was 84.9%.
Data center units drove the largest growth
Core Data Center revenue was $11,524 million versus $1,530 million a year ago, and Cloud Memory revenue was $13,769 million versus $3,386 million.
Fourth-quarter guidance points to further growth
Micron guides to revenue of $50.0 billion ± $1.0 billion, gross margin of approximately 86%, and non-GAAP EPS of $31.00 ± $1.00.
Cash generation and balance sheet strengthened
Operating cash flow was $25.39 billion and adjusted free cash flow was $18.3 billion. Long-term debt fell to $5,140 million from $14,017 million at August 28, 2025, while receivables rose to $31,025 million.
Charts
Fourth quarter worked out from the annual figure.
Data
| Q1 FY25 | $8.7B |
| Q2 FY25 | $8.1B |
| Q3 FY25 | $9.3B |
| Q4 FY25 | $11.3B * |
| Q1 FY26 | $13.6B |
| Q2 FY26 | $23.9B |
| Q3 FY26 | $41.5B |
| Q4 FY26 | $54.2B * |
Data
| Q1 FY25 | $1.67 |
| Q2 FY25 | $1.41 |
| Q3 FY25 | $1.68 |
| Q1 FY26 | $4.60 |
| Q2 FY26 | $12.07 |
| Q3 FY26 | $24.67 |
Fourth-quarter EPS appears once the press release is read; filings report it only for the full year.
Data
| Q1 FY25 | 25.0% |
| Q2 FY25 | 22.0% |
| Q3 FY25 | 23.3% |
| Q4 FY25 | 32.3% |
| Q1 FY26 | 45.0% |
| Q2 FY26 | 67.6% |
| Q3 FY26 | 80.4% |
| Q4 FY26 | 80.7% |
Data
| Q1 FY25 | $38.0M |
| Q2 FY25 | -$113.0M |
| Q3 FY25 | $1.7B |
| Q4 FY25 | $72.0M |
| Q1 FY26 | $3.0B |
| Q2 FY26 | $5.5B |
| Q3 FY26 | $17.6B |
| Q4 FY26 | $32.9B |
Operating cash flow minus capital expenditure, from cash flow statements.
Questions
What were Micron's key results for fiscal Q3 2026?
Revenue was $41.46 billion, GAAP net income was $28.24 billion, or $24.67 per diluted share, and non-GAAP EPS was $25.11. GAAP gross margin was 84.6%.
What is Micron's guidance for fiscal Q4 2026?
Micron expects revenue of $50.0 billion ± $1.0 billion and gross margin of approximately 86%. It guides to non-GAAP diluted EPS of $31.00 ± $1.00 and GAAP diluted EPS of $30.73 ± $1.00.
Which business units grew the most?
Cloud Memory revenue was $13,769 million, Core Data Center was $11,524 million, and Mobile and Client was $11,521 million. Core Data Center was $1,530 million a year ago.
How much cash did Micron generate and spend on capital?
Operating cash flow was $25.39 billion. Investments in capital expenditures, net were $7.1 billion, leaving adjusted free cash flow of $18.3 billion.
What did management say about the outlook and customer demand?
CEO Sanjay Mehrotra cited the strategic value of memory in the AI era and an even stronger Q4 outlook. He said multi-year Strategic Customer Agreements should improve the durability and predictability of financial performance.