
Mizuho Financial Group (MFG) · Banking
Mizuho Financial Group Q1 FY2026 earnings: summary, key numbers & outlook
Results filed 30 Jul 2026 · Quarter ended 30 Jun 2026
Slides (20 pages)Press release ↗Investor relations ↗
Summaries and transcripts are machine-generated and can contain errors.
In brief
Mizuho's corporate fee and markets businesses drove a strong quarter as domestic lending spreads improved and retail deposits grew with new account openings.
Growth was broad across customer groups. Domestic corporate solutions fees rose, with credit-related fees at CIBC up 28.5 billion yen year on year, and the Retail & Business Banking Company's net business profits more than doubled. Markets were the biggest swing factor: Sales & Trading benefited from higher equity flows in and outside Japan, and banking revenue captured market movements. Retail deposits grew as new accounts opened, and NISA accounts reached 840k.
Management is steering toward higher yen rates and deeper corporate and wealth relationships, and has described the current level of returns as a milestone rather than a final objective. The tension is that the Global Corporate & Investment Banking Company's profit fell while costs rose with yen depreciation, inflation, growth investment and governance. Markets earnings can also swing with conditions, so durability matters.
No call transcript for this quarter, so this summary also draws on: Pulse 2.0 ↗.
Slides & documents
Open the slide deck (PDF, 20 pages) ↗

Showing the first 6 of 20 pages.
SEC filing
Key numbers
- Diluted earnings per share (JPY) · GAAP
- 173.53
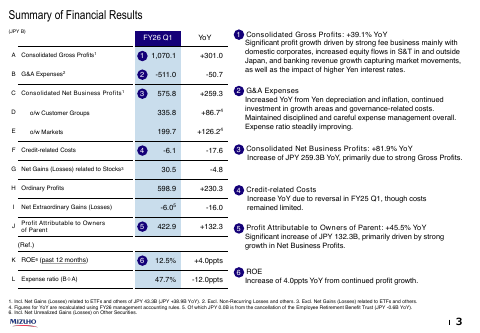
- Consolidated net business profits (JPY B)
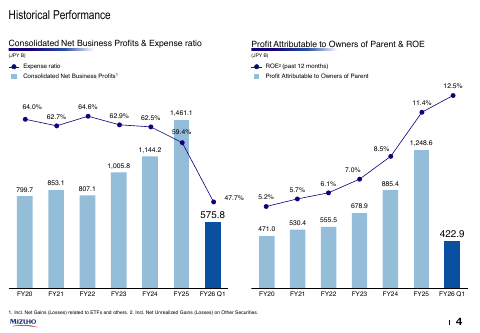
- 575.8B
up from 115.90 a year ago
up 81.9% from a year ago
| Segment or metric | Value | Change |
|---|---|---|
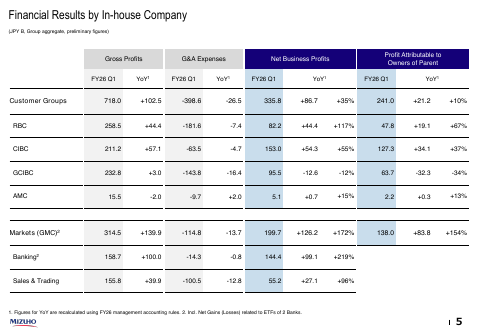
| Global Markets Company net business profits (JPY B) | 199.7B | +172% YoY |
| Corporate & Investment Banking Company net business profits (JPY B) | 153.0B | +55% YoY |
| Global Corporate & Investment Banking Company net business profits (JPY B) | 95.5B | -12% YoY |
| Retail & Business Banking Company net business profits (JPY B) | 82.2B | +117% YoY |
| Return on equity (past 12 months) | 12.5% | up 4.0ppts YoY |
Where each number comes from
- Diluted earnings per share (JPY): “Diluted Earningsper Share ofCommon Stock ¥ | ¥ 1Q F2026 | 173.53 | 173.53 1Q F2025 | 115.90 | 115.90”
- Consolidated net business profits (JPY B): “B G&A Expenses2 2 -511.0 -50.7 C Consolidated Net Business Profits1 3 575.8 +259.3 2 G&A Expenses Increased YoY from Yen depreciation and inflation”
- Global Markets Company net business profits (JPY B): “Markets (GMC)2 314.5 +139.9 -114.8 -13.7 199.7 +126.2 +172% 138.0 +83.8 +154% Banking2 158.7 +100.0 -14.3 -0.8 144.4 +99.1 +219%”
- Corporate & Investment Banking Company net business profits (JPY B): “CIBC 211.2 +57.1 -63.5 -4.7 153.0 +54.3 +55% 127.3 +34.1 +37% GCIBC 232.8 +3.0 -143.8 -16.4 95.5 -12.6 -12%”
- Global Corporate & Investment Banking Company net business profits (JPY B): “CIBC 211.2 +57.1 -63.5 -4.7 153.0 +54.3 +55% 127.3 +34.1 +37% GCIBC 232.8 +3.0 -143.8 -16.4 95.5 -12.6 -12%”
- Retail & Business Banking Company net business profits (JPY B): “Customer Groups 718.0 +102.5 -398.6 -26.5 335.8 +86.7 +35% 241.0 +21.2 +10% RBC 258.5 +44.4 -181.6 -7.4 82.2 +44.4 +117% 47.8 +19.1 +67%”
- Return on equity (past 12 months): “K ROE6 (past 12 months) 6 12.5% +4.0ppts 6 ROE L Expense ratio (B÷A) 47.7% -12.0ppts Increase of 4.0ppts YoY from continued profit growth.”
Copied from the press release ↗ and other documents in the SEC filing ↗. A figure is published only if its sentence is in those documents.
Outlook
| Metric | Period | Outlook |
|---|---|---|
| Other | Fiscal 2026 (year ending March 31, 2027), profit attributable to owners of parent, in ¥ million | 1,400,000 |
| Eps | Fiscal 2026 (year ending March 31, 2027), earnings per share in yen | 575.08 |
| Other | Fiscal 2026 annual cash dividend per share, in yen | 150.00 |
Key takeaways
Domestic corporate solutions drove customer-group growth
CIBC non-interest income rose 41.8 billion yen year on year, led by Solutions Business and credit-related fees. This shows demand from large Japanese corporates for fee-based services beyond lending.
Retail banking profit more than doubled year on year
RBC net business profits rose 117% as yen interest rates lifted deposit-loan margins and fees grew. Retail deposits also rose as new account openings grew.
Individual wealth business is expanding steadily
Individual wealth management income rose 6.5 billion yen to 40.0 billion yen, and total custody assets reached 71.2T. NISA accounts reached 840k, up 20k.
Markets division delivered the largest swing
Markets net business profits rose 172%, with Banking up 219% and Sales & Trading up 96%. Management cited higher equity flows in and outside Japan and revenue from market movements.
Overseas corporate banking lagged domestic businesses
GCIBC net business profits fell 12% even as investment banking fees grew, with Americas and EMEA credit-related fees weaker. Expenses rose, making overseas profitability the weak spot in an otherwise strong quarter.
Questions
Which Mizuho businesses grew most this quarter?
Markets (GMC) net business profits rose 172% and RBC rose 117%, with CIBC up 55%. GCIBC was the exception, down 12%.
What is driving retail banking growth?
Higher yen interest rates improved domestic lending spreads, and retail deposits grew as new account openings increased. Individual wealth management income also rose 6.5 billion yen.
How are Mizuho's corporate customers using its services?
Domestic corporates are driving fee growth, with CIBC non-interest income up 41.8 billion yen, led by solutions business and credit-related fees. Investment banking fees also rose at GCIBC.
What is the main risk to the strategy?
Overseas corporate banking profit fell and expenses are rising with yen depreciation, inflation and investment in growth areas and governance. Markets earnings can also vary with market conditions.
How is Mizuho positioning its balance sheet?
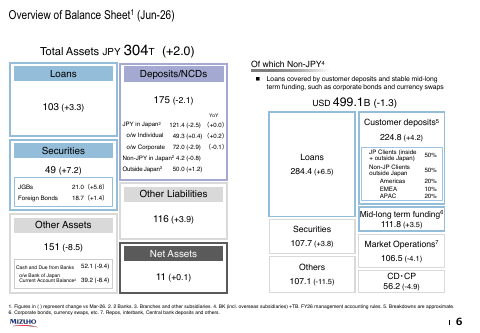
Loans rose to 103 trillion yen, with domestic corporate lending growing in CIBC and overseas loans stable. Securities holdings increased, led by JGBs and foreign bonds.