
Meta Platforms (META) · Internet & Advertising
Meta Platforms Q2 2026 earnings: summary, key numbers & outlook
Results filed 29 Jul 2026 · Quarter ended 30 Jun 2026
Slides (18 pages)Official transcript (PDF) ↗Press release ↗Investor relations ↗
Summaries and transcripts are machine-generated and can contain errors.
In brief
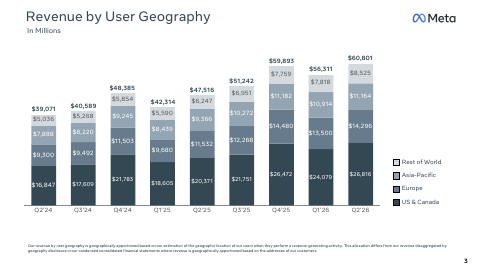
Meta reported Q2 2026 revenue of $60.80 billion, an increase of 28% year-over-year, with net income of $15,848 million and diluted EPS of $6.18.
Meta's revenue grew 28% year-over-year to $60.80 billion, driven by 14% more ad impressions and a 12% higher average price per ad. Costs grew 55% to $42.03 billion, including $2.40 billion of legal charges and $1.18 billion of severance. As a result, income from operations fell 8% to $18,775 million and diluted EPS fell to $6.18 from $7.14. Free cash flow was just $784 million.
Management expects third quarter 2026 revenue of $61-64 billion and full year 2026 expenses of $165-169 billion. It still expects 2026 operating income above 2025. Capital expenditures are guided to $130-145 billion. The main tension is that heavy AI infrastructure spending is squeezing margins and cash flow. Youth-related trials in the U.S. this year may also ultimately result in a material loss.
Slides & documents
Open the slide deck (PDF, 18 pages) ↗
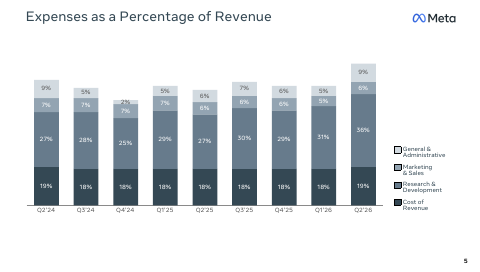
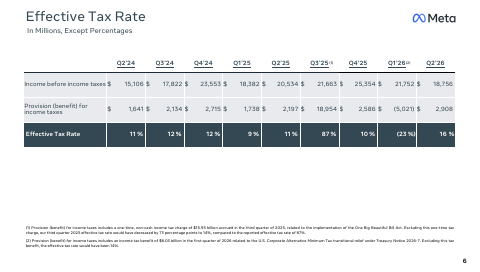
Showing the first 6 of 18 pages.
From Meta Platforms investor relations
- Earnings Call TranscriptCompany's official transcript ↗
- Follow Up Call TranscriptCompany's official transcript ↗
- WebcastWebcast replay ↗
- Form 10-QDocument ↗
SEC filing
Key numbers
- Revenue · GAAP
- $60.80 billion
- Net income · GAAP
- $15.8B
- Diluted EPS · GAAP
- $6.18
- Income from operations · GAAP
- $18.8B
- Operating margin · GAAP
- 31%
- Cash flow from operating activities · GAAP
- $31.86 billion
- Free cash flow · non-GAAP
- $784 million
- Capital expenditures, including principal payments on finance leases
- $31.08 billion
up 28% year-over-year
down 14% from a year ago
down 13% from a year ago
down 8% from a year ago
down from 43% a year ago
| Segment or metric | Value | Change |
|---|---|---|
| Family daily active people (June 2026 average) | 3.60 billion | up 3% year-over-year |
| Ad impressions | 14% | increase year-over-year |
| Average price per ad | 12% | increase year-over-year |
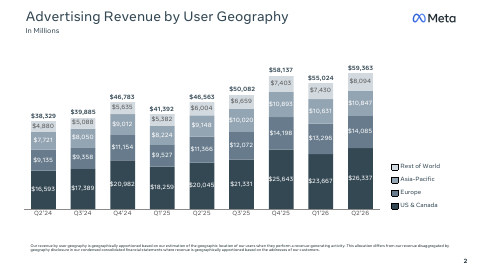
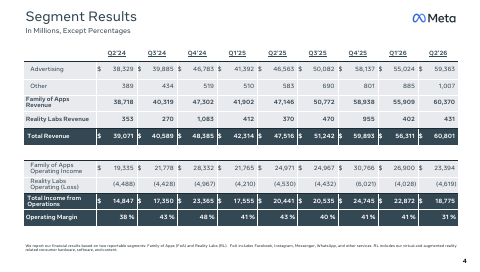
| Advertising revenue | $59,363 | 27% GAAP growth year-over-year |
| Family of Apps revenue | 60,370 | |
| Reality Labs revenue | 431 | |
| Family of Apps income from operations | $23,394 | |
| Reality Labs loss from operations | (4,619) |
Where each number comes from
- Revenue: “Revenue – Revenue was $60.80 billion, an increase of 28% year-over-year. Revenue on a constant currency basis would have increased by 27% year-over-year.”
- Net income: “Net income | $15,848 | $18,337 | (14)% Diluted earnings per share (EPS) | $6.18 | $7.14 | (13)%”
- Diluted EPS: “Net income | $15,848 | $18,337 | (14)% Diluted earnings per share (EPS) | $6.18 | $7.14 | (13)%”
- Income from operations: “Costs and expenses | 42,026 | 27,075 | 55% Income from operations | $18,775 | $20,441 | (8)% Operating margin | 31% | 43%”
- Operating margin: “Costs and expenses | 42,026 | 27,075 | 55% Income from operations | $18,775 | $20,441 | (8)% Operating margin | 31% | 43%”
- Cash flow from operating activities: “Cash flow – Cash flow from operating activities was $31.86 billion, and free cash flow was $784 million.(1)”
- Free cash flow: “Cash flow – Cash flow from operating activities was $31.86 billion, and free cash flow was $784 million.(1)”
- Capital expenditures, including principal payments on finance leases: “Capital expenditures – Capital expenditures, including principal payments on finance leases, were $31.08 billion.”
- Family daily active people (June 2026 average): “Family daily active people (DAP) – DAP was 3.60 billion on average for June 2026, an increase of 3% year-over-year.”
- Ad impressions: “Ad impressions – Ad impressions delivered across our Family of Apps increased by 14% year-over-year.”
- Average price per ad: “Average price per ad – Average price per ad increased by 12% year-over-year.”
- Advertising revenue: “Revenue: Advertising | $59,363 | $46,563 | $114,387 | $87,955 Other revenue | 1,007 | 583 | 1,891 | 1,093 Family of Apps | 60,370 | 47,146”
- Family of Apps revenue: “Other revenue | 1,007 | 583 | 1,891 | 1,093 Family of Apps | 60,370 | 47,146 | 116,278 | 89,048 Reality Labs | 431 | 370 | 833 | 782”
- Reality Labs revenue: “Other revenue | 1,007 | 583 | 1,891 | 1,093 Family of Apps | 60,370 | 47,146 | 116,278 | 89,048 Reality Labs | 431 | 370 | 833 | 782”
- Family of Apps income from operations: “Income (loss) from operations: Family of Apps | $23,394 | $24,971 | $50,294 | $46,736 Reality Labs | (4,619) | (4,530) | (8,647) | (8,739)”
- Reality Labs loss from operations: “Income (loss) from operations: Family of Apps | $23,394 | $24,971 | $50,294 | $46,736 Reality Labs | (4,619) | (4,530) | (8,647) | (8,739)”
Copied from the press release ↗ and other documents in the SEC filing ↗. A figure is published only if its sentence is in the filing.
| From the filing | Q2 2026 | vs year ago | vs last quarter |
|---|---|---|---|
| Revenue | $60.8B | +28.0% | +8.0% |
| Operating income | $18.8B | −8.2% | −17.9% |
| Net income | $15.8B | −13.6% | −40.8% |
| Diluted EPS | $6.18 | −13.4% | −40.8% |
| Free cash flow | $1.7B | −80.6% | −86.8% |
| Operating margin | 30.9% | −12.1 pts | −9.7 pts |
Calculated by code from XBRL, not by the model.
Outlook
| Metric | Period | Outlook |
|---|---|---|
| Total revenue | third quarter 2026 | $61-64 billion |
| Foreign currency headwind to year-over-year total revenue growth | third quarter 2026 | approximately 1% |
| Total expenses | full year 2026 | $165-169 billion |
| Capital expenditures, including principal payments on finance leases | 2026 | $130-145 billion |
| Tax rate | remaining quarters of 2026 | 15-17% |
| Operating income versus 2025 | 2026 | above 2025 operating income |
Key takeaways
Revenue grew 28% on ads volume and price
Ad impressions increased by 14% and average price per ad increased by 12% year-over-year. Revenue on a constant currency basis would have increased by 27%.
Costs rose 55%, cutting operating margin to 31%
Total costs and expenses were $42.03 billion, including $2.40 billion of legal charges and $1.18 billion of severance. Operating margin was 31% versus 43% a year ago.
Free cash flow fell to $784 million
Operating cash flow was $31.86 billion, but capital expenditures were $31.08 billion. Free cash flow was $8,549 million a year earlier.
Balance sheet shifted toward debt-funded AI buildout
Long-term debt was $83.66 billion as of June 30, 2026, up from $58,744 million at December 31, 2025. The company issued $24,910 million of long-term debt in the quarter and made no share repurchases.
Outlook: higher expenses, narrower capex, legal risk
Meta guided third quarter 2026 revenue to $61-64 billion and full year expenses to $165-169 billion. It warned that youth-related trials may ultimately result in a material loss.
Charts
Fourth quarter worked out from the annual figure.
Data
| Q4 2024 | $48.4B * |
| Q1 2025 | $42.3B |
| Q2 2025 | $47.5B |
| Q3 2025 | $51.2B |
| Q4 2025 | $59.9B * |
| Q1 2026 | $56.3B |
| Q2 2026 | $60.8B |
| Q3 2026 | $64.6B |
Data
| Q1 2025 | $6.43 |
| Q2 2025 | $7.14 |
| Q3 2025 | $1.05 |
| Q1 2026 | $10.44 |
| Q2 2026 | $6.18 |
| Q3 2026 | $3.83 |
Fourth-quarter EPS appears once the press release is read; filings report it only for the full year.
Data
| Q4 2024 | 48.3% |
| Q1 2025 | 41.5% |
| Q2 2025 | 43.0% |
| Q3 2025 | 40.1% |
| Q4 2025 | 41.3% |
| Q1 2026 | 40.6% |
| Q2 2026 | 30.9% |
| Q3 2026 | 20.1% |
Data
| Q4 2024 | $13.6B |
| Q1 2025 | $11.1B |
| Q2 2025 | $9.0B |
| Q3 2025 | $11.2B |
| Q4 2025 | $14.8B |
| Q1 2026 | $13.2B |
| Q2 2026 | $1.7B |
| Q3 2026 | -$1.2B |
Operating cash flow minus capital expenditure, from cash flow statements.
Questions
What were Meta's Q2 2026 revenue and EPS?
Revenue was $60.80 billion, up 28% year-over-year (27% in constant currency). Diluted EPS was $6.18, down from $7.14 a year ago.
Why did Meta's operating income fall despite higher revenue?
Total costs and expenses rose 55% to $42.03 billion, including $2.40 billion of legal charges and $1.18 billion of severance from the May 2026 headcount reduction. Income from operations was $18,775 million, down 8%, and operating margin fell to 31% from 43%.
What is Meta's guidance for Q3 2026?
Meta expects third quarter 2026 total revenue of $61-64 billion, assuming foreign currency is an approximately 1% headwind to year-over-year growth. It expects a tax rate of 15-17% for the remaining quarters of 2026.
How much is Meta spending on capital expenditures?
Q2 capital expenditures, including principal payments on finance leases, were $31.08 billion. Meta now expects 2026 capex of $130-145 billion, narrowed from $125-145 billion.
What are the main risks Meta flagged?
Meta cited active legal and regulatory matters, including scrutiny on youth-related issues and several U.S. youth-related trials scheduled this year that may ultimately result in a material loss. Free cash flow of $784 million also shows heavy infrastructure spending is absorbing cash.