
Moody's (MCO) · Exchanges & Data
Moody's Q2 2026 earnings: summary, key numbers & outlook
Results filed 22 Jul 2026 · Quarter ended 30 Jun 2026
Slides (40 pages)Official transcript (PDF) ↗Press release ↗Investor relations ↗
Summaries and transcripts are machine-generated and can contain errors.
In brief
Moody's embedded its data into AI platforms from Microsoft and Amazon while MIS rated over $2T of debt, with data center financing driving issuance.
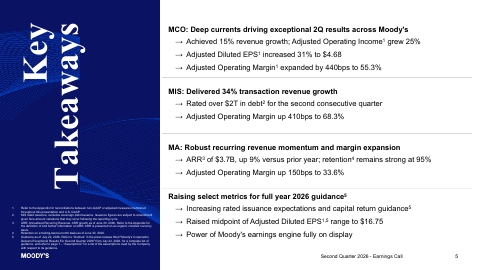
Moody's Investors Service saw broad demand across corporate, structured, bank and infrastructure issuers, with public, project and infrastructure finance led by data center and technology buildout. Private credit and fund finance also grew. In Moody's Analytics, customers kept adopting decision-grade data inside lending, insurance and know-your-customer workflows, and retention held at 95%. The company also sold its Regulatory Solutions business.
Management is steering Moody's toward being the trusted data and context layer that AI tools draw on, through MCP and API connections and cloud marketplace listings. The main tension is dependence on debt issuance: much of the hyperscaler activity is expected to land in the first half, and an AI-driven change in how customers get information could erode Moody's position.
No call transcript for this quarter, so this summary also draws on: TickerTrends ↗.
Slides & documents
Open the slide deck (PDF, 40 pages) ↗



Showing the first 6 of 40 pages.
From Moody's investor relations
- Earnings Prepared RemarksCompany's official transcript ↗
- WebcastWebcast replay ↗
- Financial StatementsFinancial tables ↗
SEC filing
Key numbers
- MCO revenue · GAAP
- $2.2 billion
- Net income attributable to Moody's · GAAP
- $878.0M
- Diluted EPS · GAAP
- $5.03
- Adjusted diluted EPS · non-GAAP
- $4.68
- MCO operating margin · GAAP
- 47.9%
- MCO adjusted operating margin · non-GAAP
- 55.3%
- Year-to-date operating cash flow · GAAP
- $1,718 million
- Year-to-date free cash flow · non-GAAP
- $1,532 million
up 15% from the prior-year period
vs $578 a year ago
up 57% from the prior-year period
up 31% from the prior-year period
up from 43.1% a year ago
up 440 bps from a year ago
up 32%
up 34%
| Segment or metric | Value | Change |
|---|---|---|
| MIS revenue | $1.3B | up 25% |
| MIS transactional revenue | $891.0M | up 34% |
| MA revenue | $925.0M | up 4%; up 8% organic constant currency |
| MA ARR | $3.7B | up 9% |
| Decision Solutions ARR | $1.6B | up 10% |
| KYC ARR | $478.0M | up 13% |
Where each number comes from
- MCO revenue: “MCO revenue of $2.2 billion increased 15% from the prior-year period, and 16% on an organic constant currency2 basis.”
- Net income attributable to Moody's: “Net income attributable to Moody's | $878 | $578 | $1,539 | $1,203 Earnings per share attributable to Moody's common shareholders Basic | $5.04”
- Diluted EPS: “MCO Diluted EPS | $5.03 | $3.21 | 57% MCO Adjusted Diluted EPS2 | $4.68 | $3.56 | 31%”
- Adjusted diluted EPS: “MCO Diluted EPS | $5.03 | $3.21 | 57% MCO Adjusted Diluted EPS2 | $4.68 | $3.56 | 31%”
- MCO operating margin: “MCO Operating Margin | 47.9% | 43.1% | 480 bps MCO Adjusted Operating Margin2 | 55.3% | 50.9% | 440 bps”
- MCO adjusted operating margin: “MCO Operating Margin | 47.9% | 43.1% | 480 bps MCO Adjusted Operating Margin2 | 55.3% | 50.9% | 440 bps”
- Year-to-date operating cash flow: “Year-to-date operating cash flow of $1,718 million up 32%; Free Cash Flow2 of $1,532 million up 34%.”
- Year-to-date free cash flow: “Year-to-date operating cash flow of $1,718 million up 32%; Free Cash Flow2 of $1,532 million up 34%.”
- MIS revenue: “MIS Revenue | $1,260 | $1,010 | 25% MIS Transactional Revenue | $891 | $663 | 34% MIS Adjusted Operating Margin | 68.3% | 64.2% | 410 bps”
- MIS transactional revenue: “MIS Revenue | $1,260 | $1,010 | 25% MIS Transactional Revenue | $891 | $663 | 34% MIS Adjusted Operating Margin | 68.3% | 64.2% | 410 bps”
- MA revenue: “MA Revenue | $925 | $888 | 4% MA Organic Constant Currency Revenue2 | $920 | $852 | 8% MA ARR3 | $3,661 | $3,372 | 9%”
- MA ARR: “MA Revenue | $925 | $888 | 4% MA Organic Constant Currency Revenue2 | $920 | $852 | 8% MA ARR3 | $3,661 | $3,372 | 9%”
- Decision Solutions ARR: “Total Decision Solutions | 1,621 | 10% Research and Insights | 1,037 | 6% Data and Information | 1,003 | 8% Total MA ARR | 3,661 | 9%”
- KYC ARR: “Banking | $420 | 10% Insurance | 723 | 9% KYC | 478 | 13% Total Decision Solutions | 1,621 | 10%”
Copied from the press release ↗ and other documents in the SEC filing ↗. A figure is published only if its sentence is in those documents.
| From the filing | Q2 2026 | vs year ago | vs last quarter |
|---|---|---|---|
| Revenue | $2.2B | +15.1% | +5.1% |
| Operating income | $1.0B | +27.9% | +13.4% |
| Net income | $878.0M | +51.9% | +32.8% |
| Diluted EPS | $5.03 | +56.7% | +34.9% |
| Free cash flow | $688.0M | +47.0% | −18.5% |
| Operating margin | 47.9% | +4.8 pts | +3.6 pts |
Calculated by code from XBRL, not by the model.
Outlook
| Metric | Period | Outlook |
|---|---|---|
| Adjusted operating margin | full year 2026 | 52% to 53% |
| Diluted EPS | full year 2026 | $16.00 to $16.50 |
| Adjusted diluted EPS | full year 2026 | $16.50 to $17.00 |
| Effective tax rate | full year 2026 | 23% to 25% |
| Free cash flow | full year 2026 | $2.7 to $2.9 billion |
| Capital expenditures | full year 2026 | Approximately $450 million |
| Share repurchases | full year 2026 | Up to $3.0 billion |
Key takeaways
AI data center buildout is driving ratings demand
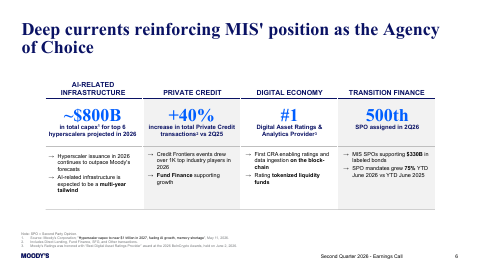
Public, project and infrastructure finance revenue grew 38%, driven by issuance tied to data centers and technology infrastructure. Management expects hyperscaler issuance to be front-loaded, with data center financing still supporting second-half strength.
Moody's is embedding its data in AI platforms
The company says it launched an AI skill on Microsoft 365 Copilot Cowork, brought Moody's Connected Intelligence into Amazon Quick, and listed its IRP on the AWS marketplace. This puts its data inside tools customers already use.
AI connections are building across customer workflows
The company cites 100+ MCP and Smart API connections, including sales and trials, and about 50% fewer false positives in KYC screening using AI-enabled screening. Moody's positions this as trusted, explainable and auditable intelligence.
Moody's Analytics ARR growth is led by Decision Solutions
ARR reached $3.7B, up 9%, with KYC up 13% and Banking up 10%, and retention at 95%. Customers are buying embedded banking, insurance and compliance software.
Private credit and digital assets open new ratings markets
Moody's reports private credit transactions up over 40% versus a year earlier, and says it is the first rating agency to deliver ratings on chain. It also cites a digital asset ratings award, extending its franchise into newer markets.
Charts
Fourth quarter worked out from the annual figure.
Data
| Q4 2024 | $1.7B * |
| Q1 2025 | $1.9B |
| Q2 2025 | $1.9B |
| Q3 2025 | $2.0B |
| Q4 2025 | $1.9B * |
| Q1 2026 | $2.1B |
| Q2 2026 | $2.2B |
| Q3 2026 | $2.0B |
Data
| Q1 2025 | $3.46 |
| Q2 2025 | $3.21 |
| Q3 2025 | $3.60 |
| Q1 2026 | $3.73 |
| Q2 2026 | $5.03 |
| Q3 2026 | $4.24 |
Fourth-quarter EPS appears once the press release is read; filings report it only for the full year.
Data
| Q4 2024 | 33.6% |
| Q1 2025 | 44.0% |
| Q2 2025 | 43.1% |
| Q3 2025 | 45.7% |
| Q4 2025 | 40.8% |
| Q1 2026 | 44.3% |
| Q2 2026 | 47.9% |
| Q3 2026 | 44.8% |
Data
| Q4 2024 | $600.0M |
| Q1 2025 | $672.0M |
| Q2 2025 | $468.0M |
| Q3 2025 | $658.0M |
| Q4 2025 | $777.0M |
| Q1 2026 | $844.0M |
| Q2 2026 | $688.0M |
| Q3 2026 | $668.0M |
Operating cash flow minus capital expenditure, from cash flow statements.
Questions
What drove Moody's Investors Service growth this quarter?
Broad strength across all lines of business, led by investment grade activity, banking issuers, private credit and fund finance, and data center and technology infrastructure issuance. Public, project and infrastructure finance revenue grew 38%.
How is Moody's using AI in its products?
It is placing its data and analytics inside third-party AI tools, including a Microsoft 365 Copilot Cowork skill and Amazon Quick, and offering MCP and Smart API connections. It describes its offering as decision-grade intelligence rather than an AI wrapper around another company's model.
How are Moody's Analytics customers behaving?
Retention is 95% and ARR grew 9%, led by Decision Solutions at 10%. KYC ARR grew 13%, and the company reports about a 50% reduction in false positives using AI-enabled screening.
What is management expecting for debt issuance?
Management raised its full-year rated issuance expectation to a mid-single-digit increase from low-single-digit, with hyperscaler jumbo activity mostly done in the first half. Data center and bank issuance are expected to drive second-half strength.
What portfolio changes did Moody's make?
It completed the divestiture of its Regulatory Solutions business and earlier divested Learning Solutions, both in Moody's Analytics. This reshapes MA's reported growth, so management emphasizes organic constant currency figures.