
McKesson (MCK) · Health Care
McKesson Q1 FY2027 earnings: summary, key numbers & outlook
Results filed 5 Aug 2026 · Quarter ended 30 Jun 2026
Slides (33 pages)Official transcript (PDF) ↗Press release ↗Investor relations ↗
Summaries and transcripts are machine-generated and can contain errors.
In brief
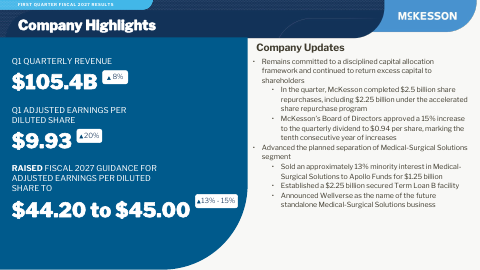
McKesson named its future standalone Medical-Surgical business Wellverse and sold about 13% of it to Apollo Funds for $1.25 billion, advancing the planned separation.
McKesson's growth this quarter came from specialty medicines and oncology. North American Pharmaceutical gained from higher prescription volumes, especially specialty products sold to health systems and strategic accounts. Oncology & Multispecialty grew on provider solutions, specialty distribution and acquisitions. Prescription Technology Solutions saw higher demand for access solutions. Medical-Surgical Solutions grew across alternate sites of care but earned less on product mix and one-time administrative costs.
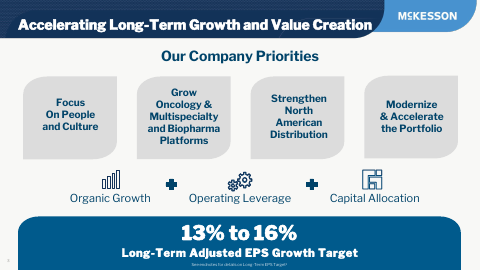
Management is concentrating on oncology, multispecialty and biopharma services while preparing to spin off Medical-Surgical Solutions as Wellverse. The company funded the separation with a $2.25 billion Term Loan B and the Apollo investment. It also plans about $5.0 billion of share repurchases this year. The main risk is that the separation may not close on the planned terms or timeline, or deliver the intended benefits.
Slides & documents
Open the slide deck (PDF, 33 pages) ↗
Showing the first 6 of 33 pages.
From McKesson investor relations
SEC filing
Key numbers
- Revenues · GAAP
- $105.4 billion
- Net income attributable to McKesson · GAAP
- $614.0M
- Diluted EPS · GAAP
- $5.15
- Adjusted EPS · non-GAAP
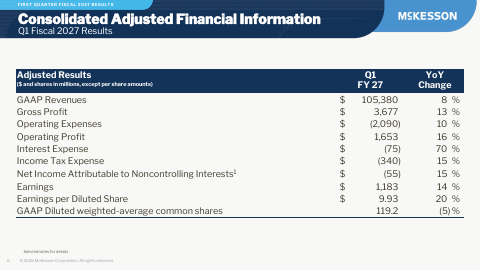
- $9.93
- Operating income · GAAP
- 1.3B
- Net cash used in operating activities · GAAP
- -$220.0M
- Free cash flow · non-GAAP
- -$372.0M
up 8% from a year ago
down 22% from $784 a year ago
down $1.10 from a year ago
up 20% from a year ago
up 27% from a year ago
compared with $(918) a year ago
compared with $(1,107) a year ago
| Segment or metric | Value | Change |
|---|---|---|
| North American Pharmaceutical revenue | $86.8 billion | up 5% |
| Oncology & Multispecialty revenue | $14.2 billion | up 33% |
| Prescription Technology Solutions revenue | $1.6 billion | up 9% |
| Medical-Surgical Solutions revenue | $2.8 billion | up 4% |
| Oncology & Multispecialty adjusted segment operating profit | $405 million | up 41% |
Where each number comes from
- Revenues: “First quarter revenues were $105.4 billion, an increase of 8% from a year ago, driven by growth in the North American Pharmaceutical and Oncology & Multispecialty segments”
- Net income attributable to McKesson: “Net income attributable to McKesson Corporation | $614 | $784 | (22)% Earnings per common share attributable to McKesson Corporation (a) Diluted | $5.15 | $6.25 | (18)%”
- Diluted EPS: “Earnings per diluted share of $5.15 decreased $1.10. •Adjusted Earnings per Diluted Share of $9.93 increased 20%.”
- Adjusted EPS: “Earnings per diluted share of $5.15 decreased $1.10. •Adjusted Earnings per Diluted Share of $9.93 increased 20%.”
- Operating income: “Gross profit | 3,685 | 3,279 | 12 Selling, distribution, general, and administrative expenses | (2,264) | (2,196) | 3 Claims and litigation charges, net | 34 | — | — Restructuring, impairment, and related charges, net | (136) | (47) | 189 Total operating expenses | (2,366) | (2,243) | 5 Operating income | 1,319 | 1,036 | 27”
- Net cash used in operating activities: “Net cash used in operating activities | $(220) | $(918) | (76)% Net cash used in investing activities | (214) | (3,564) | (94)”
- Free cash flow: “Payments for property, plant, and equipment | (112) | (111) | 1 Capitalized software expenditures | (40) | (78) | (49) Free Cash Flow (Non-GAAP) | $(372) | $(1,107) | (66)%”
- North American Pharmaceutical revenue: “North American Pharmaceutical Segment •Revenues were $86.8 billion, an increase of 5%, driven by increased prescription transaction volumes, including higher volumes from specialty products”
- Oncology & Multispecialty revenue: “Oncology & Multispecialty Segment •Revenues were $14.2 billion, an increase of 33%, driven by growth in provider solutions and specialty distribution, including contributions from acquisitions.”
- Prescription Technology Solutions revenue: “Prescription Technology Solutions Segment •Revenues were $1.6 billion, an increase of 9%, driven by increased prescription volumes in third-party logistics and access solutions.”
- Medical-Surgical Solutions revenue: “Medical-Surgical Solutions Segment •Revenues were $2.8 billion, an increase of 4%, driven by growth across alternate sites of care, led by higher volumes of specialty pharmaceuticals.”
- Oncology & Multispecialty adjusted segment operating profit: “Adjusted Segment Operating Profit was $405 million, an increase of 41%, driven by growth in provider solutions and specialty distribution, including contributions from acquisitions.”
Copied from the press release ↗ and other documents in the SEC filing ↗. A figure is published only if its sentence is in those documents.
| From the filing | Q1 FY2027 | vs year ago | vs last quarter |
|---|---|---|---|
| Revenue | $105.4B | +7.7% | +9.4% |
| Operating income | $1.3B | +27.3% | −38.7% |
| Net income | $614.0M | −21.7% | −63.5% |
| Diluted EPS | $5.15 | −17.6% | — |
| Free cash flow | -$332.0M | +67.7% | — |
| Gross margin | 3.5% | +0.1 pts | −0.7 pts |
| Operating margin | 1.3% | +0.2 pts | −0.9 pts |
Calculated by code from XBRL, not by the model.
Outlook
| Metric | Period | Outlook |
|---|---|---|
| Adjusted EPS | fiscal 2027 | $44.20 to $45.00 |
| Revenue growth | fiscal 2027 | 5% to 9% growth |
| Adjusted operating profit growth | fiscal 2027 | 9% to 13% growth |
| Effective tax rate | fiscal 2027 | 18% to 19% |
| Free cash flow | fiscal 2027 | $4.5 to $4.9 billion |
Key takeaways
Medical-Surgical business gets name and outside investor
McKesson unveiled Wellverse as the name of the future standalone Medical-Surgical Solutions business. It also sold about 13% of the unit to Apollo Funds for $1.25 billion, which moves the planned separation forward.
Specialty medicines drive pharmaceutical distribution growth
North American Pharmaceutical gained from higher specialty product volumes, particularly to health systems and strategic accounts, and from the timing of new product launches. Branded pharmaceuticals contributed less.
Oncology & Multispecialty is the fastest-growing segment
Growth came from provider solutions and specialty distribution, including contributions from acquisitions. Management says it will make focused investments to speed up oncology, multispecialty and biopharma services.
Access solutions demand lifts technology segment
Prescription Technology Solutions saw higher demand for access solutions and more prescription volume in third-party logistics. Restructuring and impairment charges fell mainly in this segment.
Medical-Surgical earned less despite growth in alternate sites
Revenue grew across alternate sites of care, led by specialty pharmaceuticals and helped by the extended care channel. Adjusted segment operating profit fell 20% on product mix and one-time administrative expenses.
Charts
Fourth quarter worked out from the annual figure.
Data
| Q3 FY25 | $95.3B |
| Q4 FY25 | $90.8B * |
| Q1 FY26 | $97.8B |
| Q2 FY26 | $103.2B |
| Q3 FY26 | $106.2B |
| Q4 FY26 | $96.3B * |
| Q1 FY27 | $105.4B |
| Q2 FY27 | $111.0B |
Data
| Q3 FY25 | $6.95 |
| Q1 FY26 | $6.25 |
| Q2 FY26 | $8.92 |
| Q3 FY26 | $9.59 |
| Q1 FY27 | $5.15 |
| Q2 FY27 | $10.44 |
Fourth-quarter EPS appears once the press release is read; filings report it only for the full year.
Data
| Q3 FY25 | 1.3% |
| Q4 FY25 | 1.8% |
| Q1 FY26 | 1.1% |
| Q2 FY26 | 1.4% |
| Q3 FY26 | 1.5% |
| Q4 FY26 | 2.2% |
| Q1 FY27 | 1.3% |
| Q2 FY27 | 1.4% |
Data
| Q3 FY25 | -$2.5B |
| Q4 FY25 | $7.6B |
| Q1 FY26 | -$1.0B |
| Q2 FY26 | $2.3B |
| Q3 FY26 | $1.1B |
| Q4 FY26 | $3.3B |
| Q1 FY27 | -$332.0M |
| Q2 FY27 | $3.0B |
Operating cash flow minus capital expenditure, from cash flow statements.
Questions
What is Wellverse?
Wellverse is the name McKesson announced on August 5, 2026 for the future standalone Medical-Surgical Solutions business. It reflects continued progress toward the planned separation.
Who is investing in McKesson's Medical-Surgical Solutions business?
On June 1, 2026, McKesson sold an approximately 13% minority interest in the business to Apollo Funds for $1.25 billion. On June 9 it also set up a $2.25 billion secured Term Loan B in support of the separation.
Where is McKesson's demand growth coming from?
Growth is coming from specialty products sold to health systems and strategic accounts, oncology provider solutions and specialty distribution including acquisitions, and access solutions in Prescription Technology Solutions.
Which business is under pressure?
Medical-Surgical Solutions saw adjusted segment operating profit fall 20%, on product mix and one-time administrative expenses, partly offset by the extended care channel.
What did McKesson change in its outlook and capital plans?
It raised fiscal 2027 adjusted EPS guidance to $44.20 to $45.00 from $43.80 to $44.60. It plans about $5.0 billion of share repurchases this year and raised the quarterly dividend 15% to $0.94 per share.