
Intercontinental Exchange (ICE) · Exchanges & Data
Intercontinental Exchange Q2 2026 earnings: summary, key numbers & outlook
Results filed 30 Jul 2026 · Quarter ended 30 Jun 2026
Slides (32 pages)Official transcript (PDF) ↗Press release ↗Investor relations ↗
Summaries and transcripts are machine-generated and can contain errors.
In brief
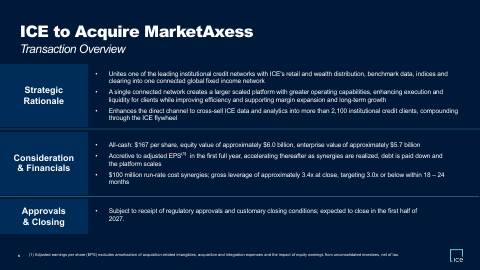
ICE agreed to acquire MarketAxess for about $6.0 billion in cash, aiming to build one connected global fixed income network and cross-sell ICE data into 2,100+ institutional clients.
ICE announced an all-cash deal to acquire MarketAxess at $167 per share, combining its institutional credit network with ICE's retail and wealth bond execution, evaluated pricing, indices and CDS clearing. Beneath a softer energy cycle, demand showed up in data and connectivity, record open interest across the exchange complex, and strong growth in agriculture, financials and equity options. Mortgage Technology added agentic AI through ICE Aurora in Encompass and MSP.
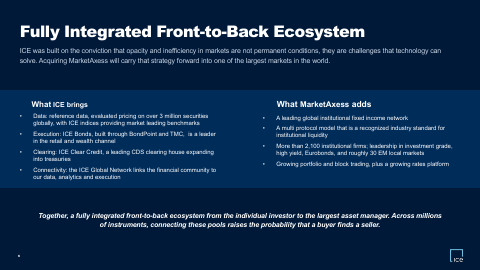
Management is steering toward an integrated front-to-back fixed income ecosystem, with data and analytics sold into MarketAxess clients, including inside AI workflows and private credit via an Apollo initiative. The main risk is execution: the deal is fully debt-financed, needs regulatory and MarketAxess stockholder approvals, is not expected to close until the first half of 2027, and requires leverage to come back down to 3.0x or below.
No call transcript for this quarter, so this summary also draws on: The Motley Fool ↗.
Slides & documents
Open the slide deck (PDF, 32 pages) ↗

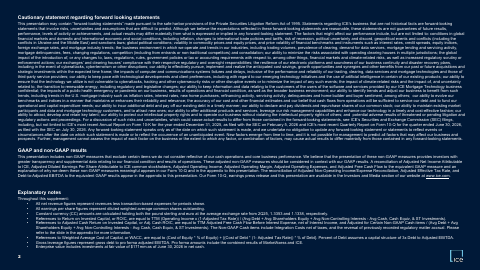
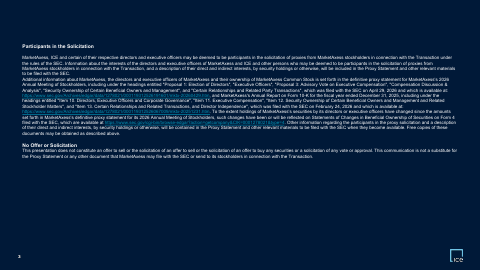

Showing the first 6 of 32 pages.
From Intercontinental Exchange investor relations
- TranscriptCompany's official transcript ↗
- WebcastWebcast replay ↗
- Pro Forma FinancialsFinancial tables ↗
SEC filing
Key numbers
- Net revenues · GAAP
- $2.7 billion
- Net income attributable to ICE · GAAP
- $958 million
- Diluted EPS · GAAP
- $1.69
- Adjusted diluted EPS · non-GAAP
- $1.90
- Operating income · GAAP
- $1.4 billion
- Operating margin · GAAP
- 52%
- Adjusted free cash flow (first half) · non-GAAP
- $2.6 billion
+5% y/y
+14% y/y
+5% y/y
+7% y/y
+28% y/y
| Segment or metric | Value | Change |
|---|---|---|
| Exchanges net revenues | $1.5 billion | 3% |
| Fixed income and data services revenues | $645 million | 8% |
| Mortgage technology revenues | $557 million | 5% |
| Energy net revenues | $518.0M | (13)% y/y |
| Fixed income data and analytics | $333.0M | 9% y/y |
| Closing solutions | $65.0M | 14% y/y |
| Annual subscription value (fixed income and data) | $2.1B | +8% y/y, constant currency |
Where each number comes from
- Net revenues: “2Q26 net revenues of $2.7 billion, +5% y/y”
- Net income attributable to ICE: “consolidated net income attributable to ICE was $958 million on $2.7 billion of consolidated revenues, less transaction-based expenses”
- Diluted EPS: “2Q26 GAAP diluted earnings per share (EPS) of $1.69, +14% y/y”
- Adjusted diluted EPS: “2Q26 adj. diluted EPS of $1.90, +5% y/y”
- Operating income: “2Q26 operating income of $1.4 billion, +7% y/y; adj. operating income of $1.6 billion, +4% y/y”
- Operating margin: “2Q26 operating margin of 52%; adj. operating margin of 61%”
- Adjusted free cash flow (first half): “Operating cash flow through the second quarter of 2026 was $3.3 billion and adjusted free cash flow was $2.6 billion.”
- Exchanges net revenues: “Second quarter consolidated net revenues were $2.7 billion including exchange net revenues of $1.5 billion, fixed income and data services revenues of $645 million and mortgage technology revenues of $557 million.”
- Fixed income and data services revenues: “Second quarter consolidated net revenues were $2.7 billion including exchange net revenues of $1.5 billion, fixed income and data services revenues of $645 million and mortgage technology revenues of $557 million.”
- Mortgage technology revenues: “Second quarter consolidated net revenues were $2.7 billion including exchange net revenues of $1.5 billion, fixed income and data services revenues of $645 million and mortgage technology revenues of $557 million.”
- Energy net revenues: “Revenues, net: Energy | $518 | $595 | (13)% | (14)% Ags and Metals | 87 | 65 | 35% | 35%”
- Fixed income data and analytics: “Fixed Income Data and Analytics | 333 | 306 | 9% | 9% Data and Network Technology | 198 | 177 | 11% | 11%”
- Closing solutions: “Origination Technology | $197 | $187 | 5% Closing Solutions | 65 | 58 | 14% Servicing Software | 226 | 220 | 2%”
- Annual subscription value (fixed income and data): “ASV(1) $2,080 $2,036 $1,990 $1,955 $1,927 Adjusted for: FX — (1) (5) (5) (9)”
Copied from the press release ↗ and other documents in the SEC filing ↗. A figure is published only if its sentence is in those documents.
| From the filing | Q2 2026 | vs year ago | vs last quarter |
|---|---|---|---|
| Revenue | $3.6B | +10.7% | −1.5% |
| Operating income | $1.4B | +7.2% | −16.5% |
| Net income | $958.0M | +12.6% | −32.2% |
| Diluted EPS | $1.69 | +14.2% | −31.9% |
| Free cash flow | $1.9B | +28.2% | +46.9% |
| Operating margin | 38.5% | −1.3 pts | −6.9 pts |
Calculated by code from XBRL, not by the model.
Outlook
| Metric | Period | Outlook |
|---|---|---|
| Fixed income and data services recurring revenue growth | 2026 | 7% - 8% |
| Non-GAAP operating expenses | 2026 | $4.190 - $4.230 billion |
| Non-GAAP operating expenses | third quarter of 2026 | $1.063 - $1.073 billion |
| Adjusted non-operating expense | third quarter of 2026 | $175 - $180 million |
| Effective tax rate | 2026 | 24 - 26% |
| Capital expenditures | 2026 | ~$850 million |
Key takeaways
MarketAxess deal builds a connected fixed income network
ICE would pair MarketAxess's institutional credit network with ICE Bonds, evaluated pricing on over 3 million securities, indices and ICE Clear Credit. The goal is to raise the probability that a buyer finds a seller across millions of instruments.
MarketAxess gives ICE direct access to 2,100+ clients
ICE plans to cross-sell evaluated pricing, reference data, index data and new analytics to institutional clients who today consume its data indirectly or not at all. It also targets liquidity scoring, transaction cost analysis and predictive pricing.
Exchange data and connectivity keeps growing steadily
Data and Connectivity Services revenue grew 12% and exchange recurring revenue grew 10%, both records in constant currency. Open interest across futures and options was up 18% year over year as of July 28, 2026.
Energy franchise is shifting toward structural growth
Since 1H21, energy open interest is up 52% and data subscribers up 68%, even as quarterly energy revenue fell 13%. Options are now 40% of energy open interest, up from roughly a quarter in 2021.
ICE Aurora brings agentic AI into mortgage workflows
ICE Aurora embeds agentic AI in Encompass and MSP with human approvals, automating regulated workflows. ICE says about 90% of US mortgages touch its network, which gives it proprietary, permissioned data.
Charts
Fourth quarter worked out from the annual figure.
Data
| Q4 2024 | $3.0B * |
| Q1 2025 | $3.2B |
| Q2 2025 | $3.3B |
| Q3 2025 | $3.0B |
| Q4 2025 | $3.1B * |
| Q1 2026 | $3.7B |
| Q2 2026 | $3.6B |
| Q3 2026 | $3.6B |
Data
| Q1 2025 | $1.38 |
| Q2 2025 | $1.48 |
| Q3 2025 | $1.42 |
| Q1 2026 | $2.48 |
| Q2 2026 | $1.69 |
| Q3 2026 | $1.67 |
Fourth-quarter EPS appears once the press release is read; filings report it only for the full year.
Data
| Q4 2024 | 35.5% |
| Q1 2025 | 37.8% |
| Q2 2025 | 39.8% |
| Q3 2025 | 39.0% |
| Q4 2025 | 39.4% |
| Q1 2026 | 45.4% |
| Q2 2026 | 38.5% |
| Q3 2026 | 38.8% |
Data
| Q4 2024 | $1.3B |
| Q1 2025 | $881.0M |
| Q2 2025 | $1.4B |
| Q3 2025 | $853.0M |
| Q4 2025 | $1.1B |
| Q1 2026 | $1.3B |
| Q2 2026 | $1.9B |
| Q3 2026 | $1.1B |
Operating cash flow minus capital expenditure, from cash flow statements.
Questions
What is ICE acquiring and why?
ICE agreed to acquire MarketAxess for $167 per share in cash, about $6.0 billion of equity value. The aim is to unite MarketAxess's institutional credit network with ICE's retail and wealth execution, data, indices and clearing.
When is the MarketAxess deal expected to close and how is it funded?
Closing is expected in the first half of 2027, subject to regulatory approvals and MarketAxess stockholder approval. It is financed entirely with new debt, starting at about 3.4x gross leverage and targeting 3.0x or below within 18 to 24 months.
How does ICE plan to monetize MarketAxess's customer base?
It plans to cross-sell data and analytics such as evaluated pricing, reference and index data, liquidity scoring, transaction cost analysis and predictive pricing to more than 2,100 institutional clients. ICE also says this extends into clients' AI workflows and private credit through its Apollo initiative.
What is ICE doing with AI in mortgage technology?
ICE Aurora embeds agentic AI in Encompass and MSP, with human approvals, to automate regulated workflows. ICE says this lowers the cost to originate and service loans and pulls more volume onto its network.
Is demand for ICE's energy markets weakening?
Energy revenue fell 13% in the quarter, but ICE points to longer-term growth: since 1H21 energy open interest is up 52% and data subscribers up 68%. Options are now 40% of energy open interest, and some trading has shifted from the Murban contract to the more liquid Dubai contract.