
Grab (GRAB) · Internet & Mobility
Grab Q2 2026 earnings: summary, key numbers & outlook
Results filed 4 Aug 2026 · Quarter ended 30 Jun 2026
Slides (27 pages)Official transcript (PDF) ↗Press release ↗Investor relations ↗
Summaries and transcripts are machine-generated and can contain errors.
In brief
Grab completed its Superbank consolidation and the Stash acquisition while a regional fuel crisis pushed it to fund driver earnings, taking active drivers to a record.
Grab's Deliveries and Mobility businesses kept growing with more users, and GrabMart groceries stood out, with transactions up 54%. Mobility transactions grew 28% as Grab made rides more affordable. Financial Services scaled sharply: Superbank was consolidated in June, the loan book reached $2.3 billion, and the Stash acquisition closed in July.
Management is steering toward a broader superapp that adds groceries, lending and banking, and is accelerating the shift of driver-partners to EVs. The tension is cost: higher fuel prices, driver support and consumer discounts to win affordable-tier users raised incentive spend, while rapid lending growth adds credit risk that management says it is watching.
No call transcript for this quarter, so this summary also draws on: AllMind AI ↗.
Slides & documents
Open the slide deck (PDF, 27 pages) ↗


Showing the first 6 of 27 pages.
From Grab investor relations
SEC filing
Key numbers
- Revenue
- $997 million
- Profit for the period
- $235 million
- Diluted EPS
- $0.06
- Operating profit
- $19 million
- Adjusted EBITDA · non-GAAP
- $168 million
- Adjusted EBITDA margin · non-GAAP
- 16.9%
- Operating cash flow
- $56 million
up 22% from a year ago
up from $20 million a year ago
up from $0.01 a year ago
up $12 million from a year ago
up 54% from a year ago
up from 13.3% a year ago
down $8 million from a year ago
| Segment or metric | Value | Change |
|---|---|---|
| Deliveries GMV | $4,249 million | up 24% year over year in constant currency |
| Mobility GMV | $2,214 million | up 18% year over year |
| Financial Services revenue | $134 million | up 59% year over year |
| Gross loan portfolio | $2.3 billion | up 197% year over year |
| Group MTUs | 53.9 | up 17% year over year |
| Customer deposits | $2.5 billion | |
| Average monthly active driver-partners | 19% | growth year over year, an all-time high |
Where each number comes from
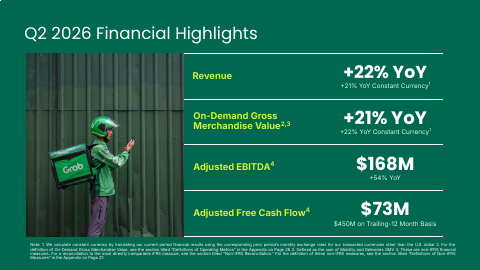
- Revenue: “Revenue grew 22% YoY, or 21% YoY on a constant currency basis, to $997 million in the second quarter of 2026, driven by continued growth across our On-Demand and Financial Services segments.”
- Profit for the period: “Profit for the period was $235 million, growing from $20 million in the prior year period.”
- Diluted EPS: “Earnings per share: Basic | $0.06 | $0.01 | $0.10 | $0.01 Diluted | $0.06 | $0.01 | $0.06 | $0.01”
- Operating profit: “Operating profit in the second quarter improved $12 million YoY to reach $19 million, primarily driven by higher revenue growth across all segments.”
- Adjusted EBITDA: “Adjusted EBITDA was $168 million for the quarter, up 54% YoY from $109 million in the prior year period, as we grew revenue and improved profitability across all our segments.”
- Adjusted EBITDA margin: “Adjusted EBITDA margin improved to 16.9% of revenue from 13.3% in the second quarter of 2025.”
- Operating cash flow: “Operating Cash Flow was $56 million in the second quarter of 2026, a reduction of $8 million YoY due to higher working capital requirements.”
- Deliveries GMV: “Deliveries GMV grew 24% YoY on a constant currency basis to $4,249 million in the quarter, driven by increases in the total number of Deliveries transactions, Deliveries MTUs, and GMV per MTU.”
- Mobility GMV: “Mobility GMV grew 18% YoY on an actual and constant currency basis, to reach $2,214 million during the quarter.”
- Financial Services revenue: “Financial Services revenue grew 59% YoY, or 62% YoY on a constant currency basis, to $134 million in the second quarter of 2026.”
- Gross loan portfolio: “Gross Loan Portfolio scaled 197% YoY to reach $2.3 billion during the quarter, from $781 million in the prior year period.”
- Group MTUs: “Group MTUs (millions of users) | 53.9 | 46.2 | 17%”
- Customer deposits: “Total customer deposits across GXS Bank (Singapore), GXBank (Malaysia), and Superbank (Indonesia) grew to $2.5 billion at the end of the second quarter of 2026.”
- Average monthly active driver-partners: “average monthly active driver-partners grew 19% YoY to reach another all-time high.”
Copied from the press release ↗ and other documents in the SEC filing ↗. A figure is published only if its sentence is in those documents.
Outlook
| Metric | Period | Outlook |
|---|---|---|
| 2026 revenue outlook | 2026 | $4.10B $4.15B |
| 2026 adjusted EBITDA outlook | 2026 | $720M $740M |
Key takeaways
Fuel crisis lifted incentives but drivers hit record
Grab committed over $7 million to support driver-partner earnings amid the fuel crisis, and average monthly active driver-partners grew 19% YoY to an all-time high. Supply is protected, but incentives rose to 10.9% of On-Demand GMV.
GrabMart is driving Deliveries acceleration
GrabMart transactions grew 54% YoY and average GrabMart MTUs grew 42%, with GMV growth 1.7x that of GrabFood. Grab's Malaysian supermarket operations under Jaya Grocer and Everrise are expanding alongside it.
Superbank and Stash deepen Financial Services
Grab consolidated Superbank in June 2026 and completed the acquisition of 100% of Stash in July, with Stash consolidated from the third quarter. Gross loan portfolio reached $2.3 billion, and excluding Superbank it doubled YoY.
Affordability is pulling in more Mobility riders
Mobility transactions grew 28% YoY, outpacing GMV growth, as Grab enhanced the affordability of its services. Targeted user investments aim to speed adoption of affordable tiers and deepen frequency.
Advertising and merchant earnings keep growing
Active advertisers on the self-serve platform grew 21% YoY and their average spend grew 24%. Average monthly active merchant-partners grew 8% while their average earnings grew 14%.
Questions
How is Grab responding to the regional fuel crisis?
It committed over $7 million to support driver-partner earnings, and average monthly active drivers grew 19% YoY to a record. It is also accelerating its EV transition, with 4W EV monthly active drivers and trips up 25% and 29% QoQ.
What is driving growth in Grab's Deliveries business?
GrabMart is the main driver, with transactions up 54% YoY and 42% growth in average MTUs. Advertising is also contributing, with self-serve advertisers up 21% YoY.
What changed in Grab's Financial Services business?
Grab consolidated Superbank in June 2026 and completed the Stash acquisition in July. Loans disbursed grew 72% YoY to $1.2 billion and the gross loan portfolio reached $2.3 billion, with NPL ratios stable.
How is Grab approaching competition and affordability?
Grab is making its services more affordable, with Mobility transactions up 28% YoY, and is investing in users to drive adoption of its affordable tiers. Incentives rose to 10.9% of On-Demand GMV as a result.
What capital return did Grab announce?
The Board authorized a new share repurchase program of up to $750 million. Grab also fully executed its earlier accelerated repurchase and forward purchase agreements for $250 million and $101 million by July 2026.