
Elevance Health (ELV) · Health Insurance
Elevance Health Q2 2026 earnings: summary, key numbers & outlook
Results filed 15 Jul 2026 · Quarter ended 30 Jun 2026
Slides (15 pages)Official transcript (PDF) ↗Press release ↗Investor relations ↗
Summaries and transcripts are machine-generated and can contain errors.
In brief
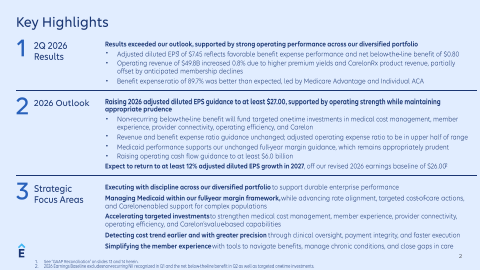
Elevance Health is accelerating targeted investments in cost management, member experience, provider connectivity and Carelon's value-based care while Medicaid cost pressure persists, aiming to return to at least 12% adjusted EPS growth in 2027.
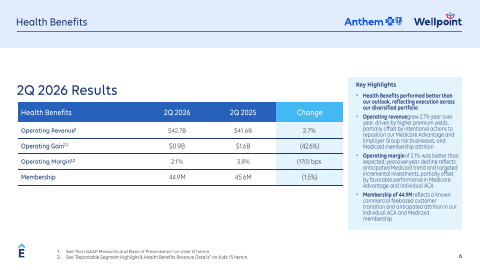
Elevance repositioned its portfolio this quarter: Medicare Advantage and Employer Group risk membership shrank on purpose, and Medicaid membership fell as expected, while Individual ACA and Medicare Advantage performed better than planned. Total medical membership was about 44.9 million, down 469 thousand from the prior quarter, partly from a known commercial fee-based customer transition. Carelon kept scaling risk-based services and specialty pharmacy, though CarelonRx script volumes fell with health plan attrition.
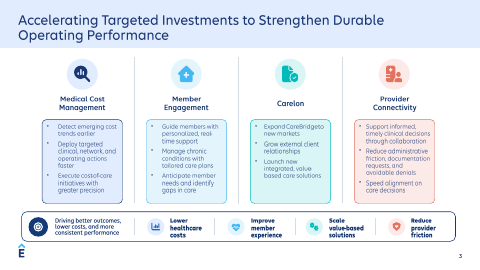
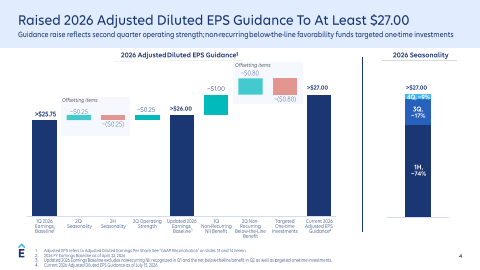
Management plans to use a non-recurring below-the-line benefit to fund one-time investments in medical cost management, member experience, provider connectivity, operating efficiency and Carelon's value-based capabilities. It targets at least 12% adjusted EPS growth in 2027 off a $26.00 baseline. The tension is that Medicaid cost trend remains elevated, with 2026 described as a trough for Medicaid margins, and the plan depends on new investments paying off.
No call transcript for this quarter, so this summary also draws on: The Motley Fool ↗.
Slides & documents
Open the slide deck (PDF, 15 pages) ↗

Showing the first 6 of 15 pages.
From Elevance Health investor relations
- Q2 2026 Earnings TranscriptCompany's official transcript ↗
- Q2 2026 Earnings WebcastWebcast replay ↗
- Q2 2026 Form 10-QDocument ↗
SEC filing
Key numbers
- Operating revenue
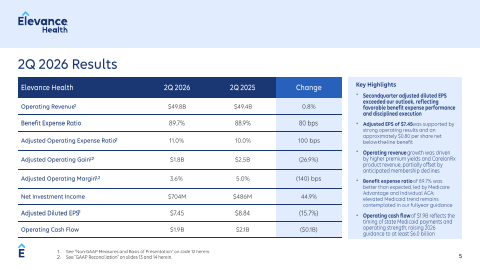
- $49.8 billion
- Shareholders' net income · GAAP
- $1.5B
- Diluted EPS · GAAP
- $6.71
- Adjusted diluted EPS · non-GAAP
- $7.45
- Operating gain · GAAP
- $1.8B
- Operating margin · GAAP
- 3.5%
- Operating cash flow · GAAP
- $1.9 billion
- Benefit expense ratio
- 89.7%
up 0.8% from 2Q 2025
down 16.1% from a year ago
down 13.1% from a year ago
down 15.7% from a year ago
down 27.3% from a year ago
down 140 bp from a year ago
up 80 basis points year over year
| Segment or metric | Value | Change |
|---|---|---|
| Health Benefits operating revenue | $42.7B | up 2.7% |
| CarelonRx operating revenue | $11.2B | up 5.7% |
| Carelon Services operating revenue | $8.0B | up 7.2% |
| Total medical membership | 44.9M | down 1.5% from a year ago |
| Medicare Advantage membership | 1.9M | down 15.9% from a year ago |
| Individual ACA operating revenue | $2.7B | up 16.8% |
| CarelonRx quarterly adjusted scripts | 80.9M | down 2.9% from a year ago |
| Carelon Services consumers served | 92.4M | down 5.0% from a year ago |
Where each number comes from
- Operating revenue: “2Q 2026 operating revenue of $49.8 billion, up 0.8% from 2Q 2025”
- Shareholders' net income: “Shareholders' net income | $1,463 | $1,743 | (16.1)% | $3,227 | $3,926 | (17.8)%”
- Diluted EPS: “2Q 2026 diluted EPS1 of $6.71 and adjusted diluted EPS2 of $7.45”
- Adjusted diluted EPS: “2Q 2026 diluted EPS1 of $6.71 and adjusted diluted EPS2 of $7.45”
- Operating gain: “Total Operating Gain1,4 | $1,763 | $2,425 | (27.3)% | $3,849 | $5,595 | (31.2)%”
- Operating margin: “Operating Margin1 | 3.5% | 4.9% Adjusted Operating Margin1,3 | 3.6% | 5.0%”
- Operating cash flow: “Operating cash flow of $1.9 billion in the quarter reflects timing of a state Medicaid pass-through payment and underlying business strength.”
- Benefit expense ratio: “The benefit expense ratio of 89.7 percent increased 80 basis points year over year, driven by expected elevated medical cost trend in our Government businesses”
- Health Benefits operating revenue: “Health Benefits | $42,720 | $41,582 | 2.7% | $85,210 | $83,013 | 2.6%”
- CarelonRx operating revenue: “CarelonRx | 11,250 | 10,643 | 5.7% | 21,850 | 20,759 | 5.3%”
- Carelon Services operating revenue: “Carelon Services | 7,975 | 7,441 | 7.2% | 15,340 | 13,977 | 9.8%”
- Total medical membership: “Total Medical Membership | 44,949 | 45,621 | 45,418 | (1.5)% | (1.0)%”
- Medicare Advantage membership: “Medicare Advantage | 1,897 | 2,255 | 1,899 | (15.9)% | (0.1)%”
- Individual ACA operating revenue: “Individual5 | 2,720 | 2,328 | 16.8% | 5,260 | 4,689 | 12.2%”
- CarelonRx quarterly adjusted scripts: “CarelonRx Quarterly Adjusted Scripts | 80.9 | 83.3 | 80.3 | (2.9)% | 0.7%”
- Carelon Services consumers served: “Carelon Services Consumers Served | 92.4 | 97.3 | 92.9 | (5.0)% | (0.5)%”
Copied from the press release ↗ and other documents in the SEC filing ↗. A figure is published only if its sentence is in those documents.
| From the filing | Q2 2026 | vs year ago | vs last quarter |
|---|---|---|---|
| Revenue | $50.5B | +1.4% | +0.6% |
| Operating income | $1.8B | −27.3% | −15.5% |
| Net income | $1.5B | −16.1% | −17.1% |
| Diluted EPS | $6.71 | −13.1% | −16.1% |
| Free cash flow | $1.6B | −9.0% | −60.3% |
| Operating margin | 3.5% | −1.4 pts | −0.7 pts |
Calculated by code from XBRL, not by the model.
Outlook
| Metric | Period | Outlook |
|---|---|---|
| Adjusted diluted EPS | full year 2026 | at least $27.00 |
| Diluted EPS (GAAP) | full year 2026 | at least $20.10 |
| Operating cash flow | full year 2026 | at least $6.0 billion |
| Adjusted diluted EPS growth | 2027 | at least 12% |
Key takeaways
Portfolio repositioning is shrinking Medicare Advantage and group risk
Medicare Advantage membership fell 15.9% year over year to 1,897 thousand, and Employer Group risk-based membership fell 5.5%. Management calls these intentional actions, trading volume for margin.
Investments target cost detection, members, providers and Carelon
Elevance is funding one-time work to detect cost trends earlier, guide members with personalized support, reduce provider friction such as avoidable denials, and expand Carelon. These are meant to make performance more consistent.
Medicaid is the main pressure point
Elevated Medicaid cost trend drove the higher benefit expense ratio, and Medicaid membership fell to 8,358 thousand. Management says Medicaid supports its unchanged margin guidance and views 2026 as a trough for Medicaid margins.
Carelon is scaling risk-based services and CareBridge
Carelon Services revenue grew on risk-based solutions, and plans include expanding CareBridge to new markets and growing external client relationships. Margins are held back by ongoing investment in the platform.
Individual ACA and Medicare Advantage beat expectations
Better-than-expected Medicare Advantage and Individual ACA performance led the benefit expense ratio. Individual ACA membership fell 7.5% sequentially to 1,317 thousand, but Individual revenue still grew 16.8% on pricing.
Charts
Fourth quarter worked out from the annual figure.
Data
| Q4 2024 | $45.4B * |
| Q1 2025 | $48.9B |
| Q2 2025 | $49.8B |
| Q3 2025 | $50.7B |
| Q4 2025 | $49.7B * |
| Q1 2026 | $50.2B |
| Q2 2026 | $50.5B |
| Q3 2026 | $51.4B |
Data
| Q1 2025 | $9.61 |
| Q2 2025 | $7.72 |
| Q3 2025 | $5.32 |
| Q1 2026 | $8.00 |
| Q2 2026 | $6.71 |
| Q3 2026 | $6.27 |
Fourth-quarter EPS appears once the press release is read; filings report it only for the full year.
Data
| Q4 2024 | 1.5% |
| Q1 2025 | 6.5% |
| Q2 2025 | 4.9% |
| Q3 2025 | 2.6% |
| Q4 2025 | 0.6% |
| Q1 2026 | 4.2% |
| Q2 2026 | 3.5% |
| Q3 2026 | 2.5% |
Data
| Q4 2024 | $384.0M |
| Q1 2025 | $821.0M |
| Q2 2025 | $1.8B |
| Q3 2025 | $775.0M |
| Q4 2025 | -$209.0M |
| Q1 2026 | $4.1B |
| Q2 2026 | $1.6B |
| Q3 2026 | $1.0B |
Operating cash flow minus capital expenditure, from cash flow statements.
Questions
What is Elevance investing in with its raised guidance?
A non-recurring below-the-line benefit funds one-time investments in medical cost management, member experience, provider connectivity, operating efficiency and Carelon's value-based capabilities. The aim is earlier detection of cost trends and less friction for members and providers.
How is Elevance's membership changing?
Medical membership was about 44.9 million, down 469 thousand from March. The causes were a known commercial fee-based customer transition and expected attrition in Individual ACA and Medicaid, plus deliberate repositioning in Medicare Advantage and Employer Group risk.
What is happening in Medicaid?
Medicaid cost trend remains elevated and Medicaid membership declined 4.3% year over year. Management says it is managing within its full-year margin framework, with rate alignment and targeted cost-of-care actions, and views 2026 as a trough for Medicaid margins.
How is Carelon performing?
Carelon operating revenue grew 6% as risk-based Carelon Services scaled and CarelonRx revenue per script rose. CarelonRx adjusted scripts fell 2.9% on health plan attrition, and specialty pharmacy profitability improved.
What is management's outlook beyond 2026?
Management expects to return to at least 12% adjusted EPS growth in 2027 off a 2026 baseline of $26.00. The long-term plan targets high single digit revenue growth and adjusted operating margin expanding to 5.0%-6.0%.