
Broadridge (BR) · Financial Technology
Broadridge Q4 FY2026 earnings: summary, key numbers & outlook
Results filed 4 Aug 2026 · Quarter ended 30 Jun 2026
Slides (36 pages)Press release ↗Investor relations ↗
Summaries and transcripts are machine-generated and can contain errors.
In brief
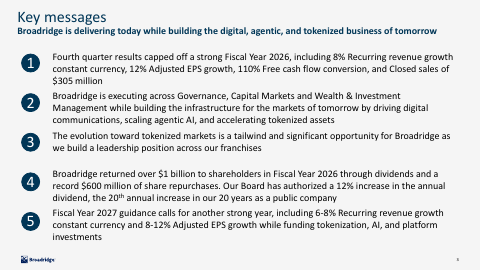
Broadridge is positioning for tokenized markets, launching its DLx tokenization platform while its tokenized repo network processes about $357B of transactions daily.
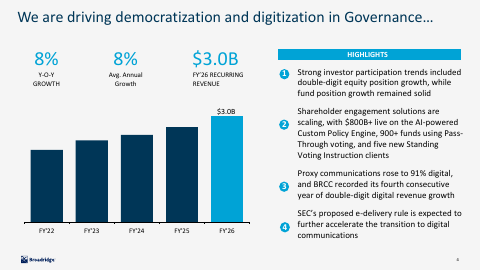
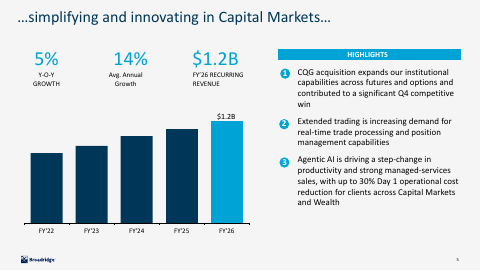
Broadridge's Governance business grew on strong investor participation, with proxy communications now 91% digital and AI-powered shareholder engagement tools scaling. In Capital Markets, the CQG acquisition broadened institutional futures and options capabilities and helped win a significant competitive deal, while agentic AI drove managed-services sales. In Wealth, the Aviso platform went live in Canada and U.S. client onboarding built a growing pipeline.
Management is steering toward digital, agentic and tokenized markets. It announced DLx, a multi-asset tokenization platform, plans to take its tokenized repo network global, and is extending digital asset capabilities into U.S. wealth. The tension is funding: fiscal 2027 guidance has to pay for tokenization, AI and platform investments while keeping growth steady, and new closed sales guidance of $290-330 million sits below the fiscal 2026 level..
Slides & documents
Open the slide deck (PDF, 36 pages) ↗
Showing the first 6 of 36 pages.
From Broadridge investor relations
SEC filing
Key numbers
- Total revenues, Q4 FY2026 · GAAP
- $2,220 million
- Net earnings, Q4 FY2026 · GAAP
- $398 million
- Diluted EPS, Q4 FY2026 · GAAP
- $3.44
- Adjusted EPS, Q4 FY2026 · non-GAAP
- $3.82
- Operating income, Q4 FY2026 · GAAP
- $546 million
- Adjusted operating income margin, Q4 FY2026 · non-GAAP
- 26.9%
- Free cash flow, FY2026 · non-GAAP
- $1.2B
- Operating cash flow, FY2026 · GAAP
- $1.3B
up 7% from a year ago
up 6% from a year ago
up 9% from $3.16
up 8% from $3.55
up 10% from a year ago
vs 27.0% a year ago
conversion 110% vs 104%
vs $1,171.3 a year ago
| Segment or metric | Value | Change |
|---|---|---|
| ICS recurring revenues, Q4 | $1,055 million | up 10% |
| ICS Regulatory recurring revenues, Q4 | $589.5M | up 14% |
| GTO recurring revenues, Q4 | $488 million | up 5% |
| GTO Capital Markets recurring revenues, Q4 | $307.1M | up 8% |
| Closed sales, Q4 | $158.0M | up 39% |
| Equity revenue position growth, Q4 | 14% | vs 14% a year ago |
Where each number comes from
- Total revenues, Q4 FY2026: “Total revenues increased 7% to $2,220 million from $2,065 million.”
- Net earnings, Q4 FY2026: “Net earnings increased 6% to $398 million and Adjusted Net earnings increased 5% to $442 million.”
- Diluted EPS, Q4 FY2026: “Diluted earnings per share increased 9% to $3.44, compared to $3.16 in the prior year period”
- Adjusted EPS, Q4 FY2026: “Adjusted earnings per share increased 8% to $3.82, compared to $3.55 in the prior year period.”
- Operating income, Q4 FY2026: “Operating income was $546 million, an increase of $48 million, or 10%.”
- Adjusted operating income margin, Q4 FY2026: “Adjusted Operating income margin was 26.9% compared to 27.0% for the prior year period.”
- Free cash flow, FY2026: “Free cash flow (Non-GAAP) | $1,233.0 | $1,056.4 Adjusted Net earnings (Non-GAAP) | $1,124.2 | $1,011.5 Free cash flow conversion (Non-GAAP) | 110% | 104%”
- Operating cash flow, FY2026: “Net cash flows from operating activities | 1,345.6 | 1,171.3 Cash Flows From Investing Activities Capital expenditures | (67.2) | (43.8)”
- ICS recurring revenues, Q4: “Recurring revenues increased $96 million, or 10%, to $1,055 million.”
- ICS Regulatory recurring revenues, Q4: “Regulatory | $589.5 | $515.2 | 14% | $1,434.9 | $1,280.6 | 12%”
- GTO recurring revenues, Q4: “Recurring revenues were $488 million, an increase of $23 million, or 5%.”
- GTO Capital Markets recurring revenues, Q4: “Capital markets | $307.1 | $285.4 | 8% | $1,184.2 | $1,115.3 | 6%”
- Closed sales, Q4: “Closed sales | $158 | $114 | 39% | $305 | $288 | 6%”
- Equity revenue position growth, Q4: “Equity revenue positions | 14% | 14% | 12% | 12%”
Copied from the press release ↗ and other documents in the SEC filing ↗. A figure is published only if its sentence is in those documents.
| From the filing | Q4 FY2026 | vs year ago | vs last quarter |
|---|---|---|---|
| Revenue | $2.2B | +7.5% | +13.6% |
| Operating income | $546.3M | +9.5% | +52.0% |
| Net income | $398.1M | +6.4% | +44.1% |
| Free cash flow | $645.3M | −5.7% | +124.5% |
| Operating margin | 24.6% | +0.5 pts | +6.2 pts |
Calculated by code from XBRL, not by the model.
Outlook
| Metric | Period | Outlook |
|---|---|---|
| Recurring revenue growth constant currency | fiscal year 2027 | 6 - 8% |
| Adjusted operating income margin | fiscal year 2027 | ~21% |
| Adjusted EPS growth | fiscal year 2027 | 8 - 12% |
| Free cash flow conversion | fiscal year 2027 | 100%+ |
| Closed sales | fiscal year 2027 | $290 - $330 million |
Key takeaways
Broadridge launches DLx tokenization platform
It announced DLx, a multi-asset end-to-end tokenization platform, alongside its tokenized repo network. This extends Broadridge from tokenized collateral into broader tokenized securities infrastructure.
Tokenized repo network scaling and going global
DLR processes about $357B of tokenized repo transactions daily, contracted volumes are expected to double, and first intraday trades are live. Broadridge is taking DLR global for G7 government securities collateral mobility.
Proxy voting extended to tokenized stocks
Broadridge says it is the first provider supporting proxy and disclosures across all three tokenized securities models. It is working with Ondo, Alpaca and Galaxy to bring shareholder rights to tokenized holders.
Agentic AI drives managed-services sales
Agentic AI is producing a step-change in productivity and strong managed-services sales, with up to 30% Day 1 operational cost reduction for clients across Capital Markets and Wealth. Shareholder engagement also scaled, with $800B+ live on the AI-powered Custom Policy Engine.
CQG deal builds institutional trading reach
The CQG acquisition expands futures and options capabilities and contributed to a significant Q4 competitive win. Extended trading is raising demand for real-time trade processing and position management.
Charts
Fourth quarter worked out from the annual figure.
Data
| Q2 FY25 | $1.6B |
| Q3 FY25 | $1.8B |
| Q4 FY25 | $2.1B * |
| Q1 FY26 | $1.6B |
| Q2 FY26 | $1.7B |
| Q3 FY26 | $2.0B |
| Q4 FY26 | $2.2B * |
| Q1 FY27 | $1.7B |
Data
| Q2 FY25 | $1.20 |
| Q3 FY25 | $2.05 |
| Q1 FY26 | $1.40 |
| Q2 FY26 | $2.42 |
| Q3 FY26 | $2.36 |
| Q1 FY27 | $0.83 |
Fourth-quarter EPS appears once the press release is read; filings report it only for the full year.
Data
| Q2 FY25 | 13.3% |
| Q3 FY25 | 19.0% |
| Q4 FY25 | 24.1% |
| Q1 FY26 | 11.9% |
| Q2 FY26 | 12.0% |
| Q3 FY26 | 18.4% |
| Q4 FY26 | 24.6% |
| Q1 FY27 | 10.4% |
Data
| Q2 FY25 | $227.9M |
| Q3 FY25 | $348.9M |
| Q4 FY25 | $684.1M |
| Q1 FY26 | $27.1M |
| Q2 FY26 | $318.5M |
| Q3 FY26 | $287.5M |
| Q4 FY26 | $645.3M |
| Q1 FY27 | $77.9M |
Operating cash flow minus capital expenditure, from cash flow statements.
Questions
What is DLx?
DLx is Broadridge's newly announced multi-asset, end-to-end tokenization platform, announced alongside its tokenized repo network.
How big is Broadridge's tokenized repo business?
DLR processes about $357B of tokenized repo transactions daily, with contracted volumes expected to double and first intraday trades live. Broadridge is taking it global for G7 government securities.
How is Broadridge using agentic AI?
It says agentic AI is driving strong managed-services sales, with up to 30% Day 1 operational cost reduction for clients across Capital Markets and Wealth. It also runs an AI-powered Custom Policy Engine with $800B+ live for shareholder engagement.
What is happening in digital communications and proxy?
Proxy communications rose to 91% digital, and Broadridge expects the SEC's proposed e-delivery rule to accelerate the shift. Equity position growth was double-digit.
What is the fiscal 2027 outlook?
Management guides to 6-8% constant currency Recurring revenue growth, 8-12% Adjusted EPS growth and Closed sales of $290-$330 million, while funding tokenization, AI and platform investments.