
Boeing (BA) · Aerospace
Boeing Q2 2026 earnings: summary, key numbers & outlook
Results filed 28 Jul 2026 · Quarter ended 30 Jun 2026
Slides (13 pages)Official transcript (PDF) ↗Press release ↗Investor relations ↗
Summaries and transcripts are machine-generated and can contain errors.
In brief
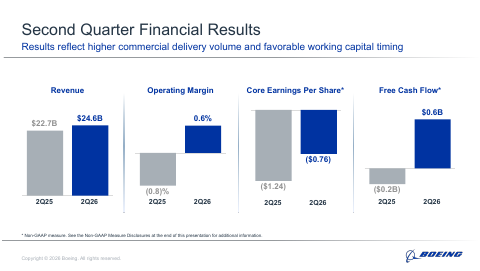
Boeing recorded second quarter revenue of $24.6 billion, GAAP loss per share of ($0.67) and core loss per share (non-GAAP)* of ($0.76), with operating cash flow of $1.4 billion and free cash flow (non-GAAP)* of $0.6 billion.
Boeing's second quarter revenue rose 8% to $24,560 million, helped by 171 commercial deliveries, up from 150 a year ago. The company still lost money, with a GAAP loss per share of ($0.67) versus ($0.92) a year earlier. Operating cash flow was $1,364 million and free cash flow turned positive at $631 million. Total backlog reached a record $715 billion, including over 6,200 commercial airplanes.
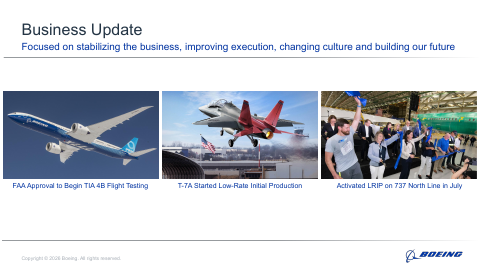
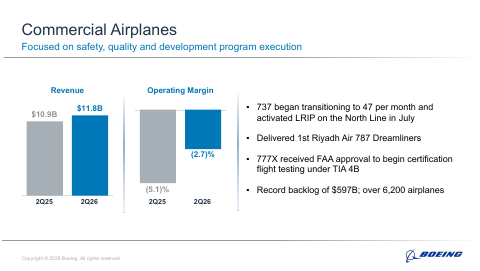
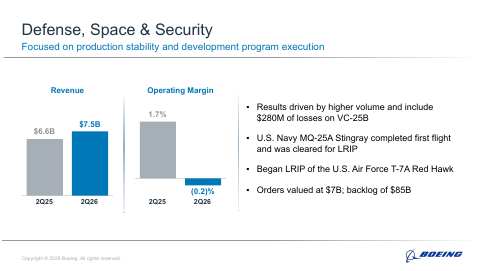
Management gave no numerical guidance in the release. It says the 737 is moving to a 47 per month production rate, and expects certification of the 737-7 and 737-10 in 2026 with first delivery in 2027, and first 777X delivery in 2027. The main tension is that profitability remains thin: Commercial Airplanes still lost money, and Defense took $280 million of VC-25B losses. Boeing also said there is more work ahead in the second half.
Slides & documents
Open the slide deck (PDF, 13 pages) ↗
Showing the first 6 of 13 pages.
From Boeing investor relations
SEC filing
Key numbers
- Revenue · GAAP
- $24.6B
- Net loss · GAAP
- $428.0M
- Diluted loss per share · GAAP
- ($0.67)
- Core loss per share · non-GAAP
- ($0.76)
- Earnings from operations · GAAP
- $156.0M
- Operating margin · GAAP
- 0.6%
- Operating cash flow · GAAP
- $1.4B
- Free cash flow · non-GAAP
- $631.0M
8% from a year ago
compared with ($612) a year ago
compared with ($0.92) a year ago
compared with ($1.24) a year ago
compared with ($176) a year ago
up 1.4 Pts from a year ago
501% from a year ago
compared with ($200) a year ago
| Segment or metric | Value | Change |
|---|---|---|
| Commercial Airplanes revenue | $11,751 | 8% from a year ago |
| Commercial Airplanes deliveries | 171 | 14% from a year ago |
| Defense, Space & Security revenue | $7,483 | 13% from a year ago |
| Global Services revenue | $5,344 | 1% from a year ago |
| Global Services operating margin | 18.1% | down 1.8 Pts from a year ago |
| Commercial Airplanes backlog | $597 billion |
Where each number comes from
- Revenue: “Revenues | $24,560 | $22,749 | 8% | $46,777 | $42,245 | 11% GAAP Earnings/(loss) from operations | $156 | ($176) | NM”
- Net loss: “Net loss | ($428) | ($612) | NM | ($435) | ($643) | NM Diluted loss per share | ($0.67) | ($0.92) | NM”
- Diluted loss per share: “Net loss | ($428) | ($612) | NM | ($435) | ($643) | NM Diluted loss per share | ($0.67) | ($0.92) | NM”
- Core loss per share: “Core operating margins | 0.0% | (1.9)% | 1.9 Pts | 0.6% | (0.6)% | 1.2 Pts Core loss per share | ($0.76) | ($1.24) | NM”
- Earnings from operations: “Revenues | $24,560 | $22,749 | 8% | $46,777 | $42,245 | 11% GAAP Earnings/(loss) from operations | $156 | ($176) | NM”
- Operating margin: “GAAP Earnings/(loss) from operations | $156 | ($176) | NM | $604 | $285 | 112% Operating margins | 0.6% | (0.8)% | 1.4 Pts | 1.3% | 0.7% | 0.6 Pts”
- Operating cash flow: “Operating cash flow | $1,364 | $227 | 501% | $1,185 | ($1,389) | NM Non-GAAP* Core operating earnings/(loss) | $1 | ($433)”
- Free cash flow: “Operating cash flow | $1,364 | $227 | $1,185 | ($1,389) Less additions to property, plant & equipment | ($733) | ($427) | ($2,008) | ($1,101) Free cash flow* | $631 | ($200)”
- Commercial Airplanes revenue: “Deliveries | 171 | 150 | 14% | 314 | 280 | 12% Revenues | $11,751 | $10,874 | 8% | $20,954 | $19,021 | 10% Loss from operations | ($322) | ($557)”
- Commercial Airplanes deliveries: “Table 4. Commercial Airplanes | Second Quarter | First Half (Dollars in Millions) | 2026 | 2025 | Change | 2026 | 2025 | Change Deliveries | 171 | 150 | 14%”
- Defense, Space & Security revenue: “Defense, Space & Security Table 5. Defense, Space & Security | Second Quarter | First Half (Dollars in Millions) | 2026 | 2025 | Change | 2026 | 2025 | Change Revenues | $7,483 | $6,617 | 13%”
- Global Services revenue: “Table 6. Global Services | Second Quarter | First Half (Dollars in Millions) | 2026 | 2025 | Change | 2026 | 2025 | Change Revenues | $5,344 | $5,281 | 1%”
- Global Services operating margin: “Earnings from operations | $968 | $1,049 | (8)% | $1,939 | $1,992 | (3)% Operating margins | 18.1% | 19.9% | (1.8) Pts | 18.1% | 19.3% | (1.2) Pts”
- Commercial Airplanes backlog: “Commercial Airplanes delivered 171 airplanes and backlog included over 6,200 airplanes valued at a record $597 billion.”
Copied from the press release ↗ and other documents in the SEC filing ↗. A figure is published only if its sentence is in the filing.
| From the filing | Q2 2026 | vs year ago | vs last quarter |
|---|---|---|---|
| Revenue | $24.6B | +8.0% | +10.5% |
| Operating income | $156.0M | — | −65.2% |
| Net income | -$444.0M | +27.3% | −11000.0% |
| Diluted EPS | -$0.67 | +27.2% | −509.1% |
| Free cash flow | $631.0M | — | — |
| Gross margin | 9.8% | −0.9 pts | −1.7 pts |
| Operating margin | 0.6% | +1.4 pts | −1.4 pts |
Calculated by code from XBRL, not by the model.
Key takeaways
Revenue grew 8% on higher deliveries
Revenue was $24,560 million, up 8%, with Commercial Airplanes deliveries rising 14% to 171. Defense, Space & Security revenue grew 13%.
Still loss-making, but losses narrowed
Diluted loss per share was ($0.67) versus ($0.92) a year ago, and core loss per share was ($0.76) versus ($1.24). Earnings from operations turned positive at $156 million.
Cash flow turned positive in the quarter
Operating cash flow was $1,364 million and free cash flow was $631 million, versus ($200) a year ago. Management cited higher deliveries and working capital timing.
Backlog hit a record $715 billion
Commercial Airplanes backlog was $597 billion with over 6,200 airplanes, after 246 net orders. Defense, Space & Security backlog was $85 billion.
Defense charges and Services margin pressure
Defense, Space & Security had $280 million of losses on the VC-25B program, leaving operating margin at (0.2)%. Global Services margin fell to 18.1% from 19.9%.
Charts
Fourth quarter worked out from the annual figure.
Data
| Q4 2024 | $15.2B * |
| Q1 2025 | $19.5B |
| Q2 2025 | $22.7B |
| Q3 2025 | $23.3B |
| Q4 2025 | $23.9B * |
| Q1 2026 | $22.2B |
| Q2 2026 | $24.6B |
| Q3 2026 | $24.2B |
Data
| Q1 2025 | -$0.16 |
| Q2 2025 | -$0.92 |
| Q3 2025 | -$7.14 |
| Q1 2026 | -$0.11 |
| Q2 2026 | -$0.67 |
| Q3 2026 | -$0.26 |
Fourth-quarter EPS appears once the press release is read; filings report it only for the full year.
Data
| Q4 2024 | -24.7% |
| Q1 2025 | 2.4% |
| Q2 2025 | -0.8% |
| Q3 2025 | -20.5% |
| Q4 2025 | 36.7% |
| Q1 2026 | 2.0% |
| Q2 2026 | 0.6% |
| Q3 2026 | 1.5% |
Data
| Q4 2024 | -$4.1B |
| Q1 2025 | -$2.3B |
| Q2 2025 | -$200.0M |
| Q3 2025 | $238.0M |
| Q4 2025 | $375.0M |
| Q1 2026 | -$1.5B |
| Q2 2026 | $631.0M |
| Q3 2026 | $464.0M |
Operating cash flow minus capital expenditure, from cash flow statements.
Questions
What were Boeing's headline results for Q2 2026?
Boeing reported revenue of $24.6 billion, a GAAP loss per share of ($0.67) and a core loss per share (non-GAAP) of ($0.76). Operating cash flow was $1.4 billion and free cash flow (non-GAAP) was $0.6 billion.
How many airplanes did Boeing deliver in Q2 2026?
Commercial Airplanes delivered 171 airplanes, up 14% from 150 a year earlier. The 737 accounted for 129 of them.
Did Boeing generate cash in the quarter?
Yes. Operating cash flow was $1,364 million and free cash flow was $631 million, compared with free cash flow of ($200) million a year earlier. Cash and marketable securities were $20.0 billion and consolidated debt was $45.9 billion.
How large is Boeing's backlog?
Total backlog was a record $715 billion. Commercial Airplanes accounted for $597 billion, Defense, Space & Security $85 billion and Global Services $33 billion.
What are the key program milestones Boeing expects?
Boeing anticipates 737-7 and 737-10 certification in 2026 with first delivery in 2027. It also expects first delivery of the 777X in 2027 and of the VC-25B in 2028.