
Airbnb (ABNB) · Internet & Travel
Airbnb Q2 2026 earnings: summary, key numbers & outlook
Results filed 6 Aug 2026 · Quarter ended 30 Jun 2026
Slides (29 pages)Official transcript (PDF) ↗Press release ↗Investor relations ↗
Summaries and transcripts are machine-generated and can contain errors.
In brief
Airbnb's Q2 2026 revenue grew 17% year-over-year to $3.6 billion, with net income of $816 million and Adjusted EBITDA of $1.3 billion at a 35% margin.
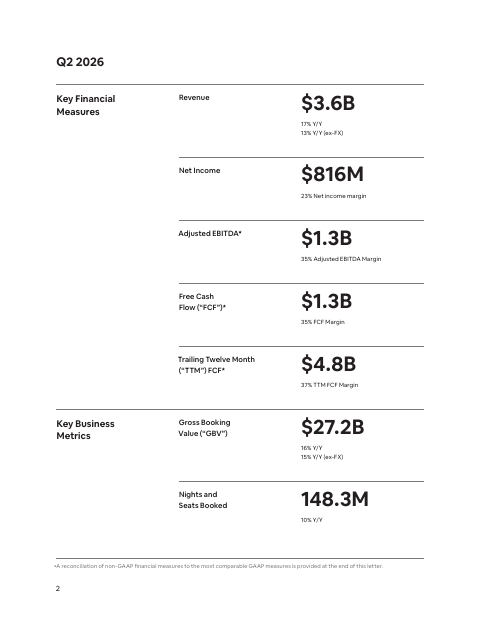
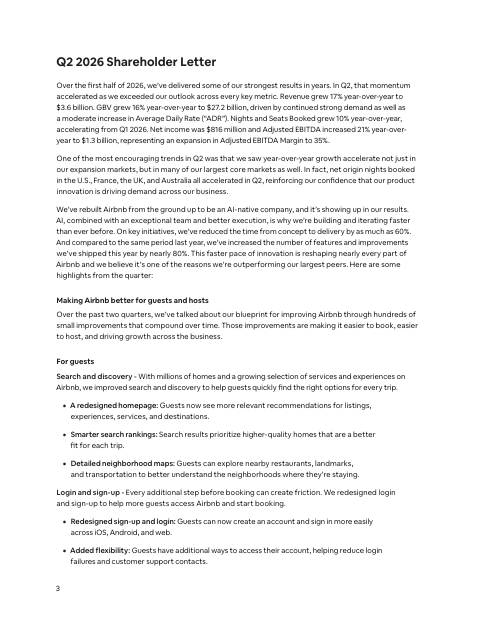
Airbnb had a strong second quarter. Revenue grew 17% to $3.6 billion, and Gross Booking Value grew 16% to $27.2 billion. Nights and Seats Booked grew 10%, faster than in the first quarter. Net income was $816 million, including a $77 million tax benefit tied to prior-year taxes. Adjusted EBITDA was $1.3 billion, a 35% margin. Free cash flow was $1.3 billion, and Airbnb repurchased $1.1 billion of stock.
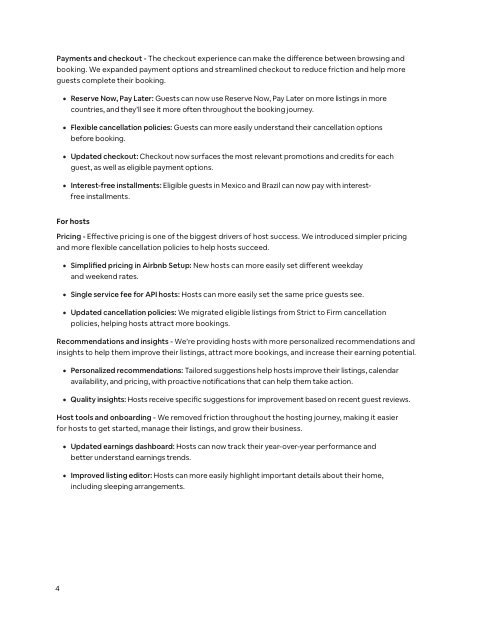
Management raised its full-year outlook. It now expects revenue growth of at least mid teens and an Adjusted EBITDA Margin of at least 35.5%. For Q3 it guided to revenue of $4.69 billion to $4.77 billion, including a roughly three percentage point FX tailwind. The main tension is that Q3 margin is expected to be down slightly because of the timing of investments. Reserve Now, Pay Later also shifts cash timing and can weigh on quarterly free cash flow.
Slides & documents
Open the shareholder letter (PDF, 29 pages) ↗

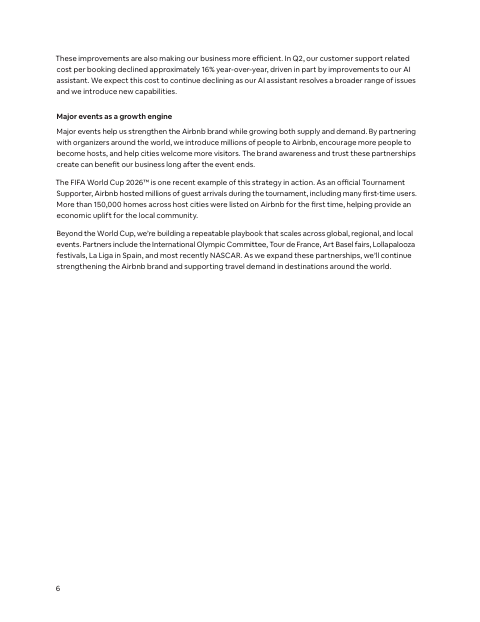
Showing the first 6 of 29 pages.
From Airbnb investor relations
- Earnings TranscriptCompany's official transcript ↗
- Earnings WebcastWebcast replay ↗
- SEC FilingsDocument ↗
SEC filing
Key numbers
- Revenue · GAAP
- $3.6 billion
- Net income · GAAP
- $816 million
- Diluted EPS · GAAP
- $1.37
- Adjusted EBITDA · non-GAAP
- $1.3 billion
- Net cash provided by operating activities · GAAP
- $1.3 billion
- Free cash flow · non-GAAP
- $1.3 billion
up 17% year-over-year
increased significantly compared to Q2 2025
up 21% from Q2 2025
up 30% year-over-year
| Segment or metric | Value | Change |
|---|---|---|
| Gross Booking Value | $27.2 billion | up 16% year-over-year |
| Nights and Seats Booked | 148.3M | up 10% year-over-year |
| Average Daily Rate (ADR) | $184 | up 5% year-over-year |
| Implied take rate | 13.2% | in-line with Q2 2025 |
| App share of nights booked | 64% | up from 59% in the prior-year period |
| Share repurchases | $1.1 billion |
Where each number comes from
- Revenue: “Revenue of $3.6 billion in Q2 2026 represented a year-over-year increase of 17%, and was primarily driven by strong growth in nights stayed”
- Net income: “Net income of $816 million in Q2 2026 increased significantly compared to Q2 2025, driven primarily by higher operating income and a $77 million benefit”
- Diluted EPS: “Net income per share attributable to Class A and Class B common stockholders: Basic $1.38 $1.29 $1.64 $1.04 Diluted $1.37 $1.27 $1.62 $1.03”
- Adjusted EBITDA: “Adjusted EBITDA in Q2 2026 of $1.3 billion increased 21% compared to $1.0 billion in Q2 2025. Adjusted 4 EBITDA Margin in Q2 2026 was 35%, compared to 34% in Q2 2025.”
- Net cash provided by operating activities: “For the three months ended June 30, 2026, net cash provided by operating activities and FCF were both 5 $1.3 billion, highlighting the strength of our cash-generative business model.”
- Free cash flow: “For the three months ended June 30, 2026, net cash provided by operating activities and FCF were both 5 $1.3 billion, highlighting the strength of our cash-generative business model.”
- Gross Booking Value: “In Q2 2026, GBV was $27.2 billion, representing a year-over-year increase of 16%. On an ex-FX basis, GBV increased 15% year-over-year”
- Nights and Seats Booked: “Nights and Seats Booked 134.4M 148.3M 277.5M 304.5M Gross Booking Value $23.5B $27.2B $48.0B $56.4B We track certain key business metrics”
- Average Daily Rate (ADR): “ADR was $184 in Q2 2026, increasing 5% compared to Q2 2025. On an ex-FX basis, ADR in Q2 2026 increased 4% year-over-year”
- Implied take rate: “During Q2 2026, the implied take rate (defined as revenue divided by GBV) of 13.2% was in-line with Q2 2025.”
- App share of nights booked: “nights booked on our app in Q2 2026 increasing 23% year-over-year and accounting for 64% of total nights booked—up from 59% in the prior-year period”
- Share repurchases: “During Q2 2026, we repurchased $1.1 billion of our Class A common stock. As of June 30, 2026, we had the authorization to purchase up to $3.4 billion”
Copied from the press release ↗ and other documents in the SEC filing ↗. A figure is published only if its sentence is in the filing.
| From the filing | Q2 2026 | vs year ago | vs last quarter |
|---|---|---|---|
| Revenue | $3.6B | +16.5% | +34.7% |
| Operating income | $758.0M | +23.9% | +781.4% |
| Net income | $816.0M | +27.1% | +410.0% |
| Operating margin | 21.0% | +1.2 pts | +17.8 pts |
Calculated by code from XBRL, not by the model.
Outlook
| Metric | Period | Outlook |
|---|---|---|
| Revenue | Q3 2026 | $4.69 billion to $4.77 billion |
| Year-over-year revenue growth | Q3 2026 | 15% to 17% |
| Adjusted EBITDA Margin | full-year 2026 | at least 35.5% |
Key takeaways
Growth accelerated across core and expansion markets
Nights and Seats Booked grew 10% year-over-year, accelerating from Q1 2026. Net origin nights booked in the U.S., France, the UK, and Australia all accelerated in Q2.
Margin expanded to 35% on higher revenue
Adjusted EBITDA rose 21% to $1.3 billion, and the Adjusted EBITDA Margin was 35% compared with 34% in Q2 2025.
Full-year outlook raised for revenue and margin
Management now expects full-year revenue growth of at least mid teens and an Adjusted EBITDA Margin of at least 35.5%.
Q3 margin guided down slightly on investment timing
Q3 revenue is guided to $4.69 billion to $4.77 billion, with Adjusted EBITDA expected to increase but its margin to be down slightly compared to Q3 2025.
AI and new offerings are driving efficiency and demand
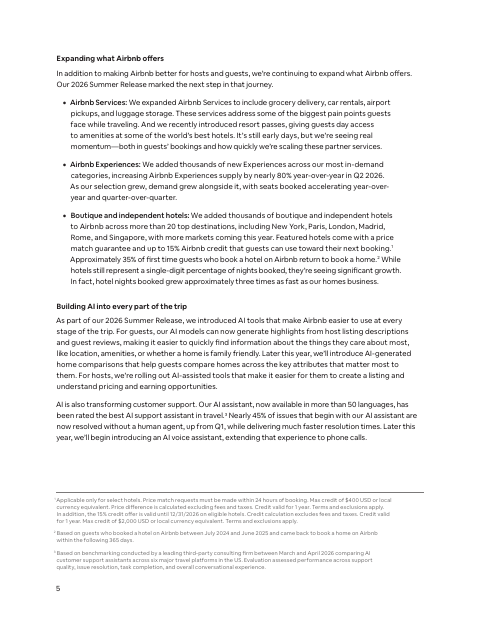
Customer support related cost per booking declined approximately 16% year-over-year, and nearly 45% of issues that begin with the AI assistant are resolved without a human agent. Hotel nights booked grew approximately three times as fast as the homes business.
Charts
Fourth quarter worked out from the annual figure.
Data
| Q4 2024 | $2.5B * |
| Q1 2025 | $2.3B |
| Q2 2025 | $3.1B |
| Q3 2025 | $4.1B |
| Q4 2025 | $2.8B * |
| Q1 2026 | $2.7B |
| Q2 2026 | $3.6B |
| Q3 2026 | $4.9B |
Data
| Q4 2024 | 17.3% |
| Q1 2025 | 1.7% |
| Q2 2025 | 19.8% |
| Q3 2025 | 39.7% |
| Q4 2025 | 9.7% |
| Q1 2026 | 3.2% |
| Q2 2026 | 21.0% |
| Q3 2026 | 41.5% |
Questions
What were Airbnb's key Q2 2026 results?
Revenue was $3.6 billion, up 17% year-over-year, and GBV was $27.2 billion, up 16%. Net income was $816 million and Adjusted EBITDA was $1.3 billion at a 35% margin.
What is Airbnb's Q3 2026 revenue guidance?
Airbnb expects revenue of $4.69 billion to $4.77 billion, or 15% to 17% year-over-year growth, including an approximate three percentage point FX tailwind. It expects Adjusted EBITDA Margin to be down slightly compared to Q3 2025.
Did Airbnb change its full-year 2026 outlook?
Yes. It now expects year-over-year revenue growth of at least mid teens and a full-year Adjusted EBITDA Margin of at least 35.5%, and it expects an effective tax rate in the high teens.
How much cash did Airbnb generate and return to shareholders?
Net cash from operating activities and free cash flow were both $1.3 billion in Q2, with trailing twelve month free cash flow of $4.8 billion. Airbnb repurchased $1.1 billion of Class A stock and had $3.4 billion of authorization remaining.
What factors could affect Airbnb's results ahead?
Q3 margin is expected to be down slightly because of the timing of investments. Reserve Now, Pay Later shifts payment and recognition of unearned fees closer to the date of stay, which affects quarterly free cash flow and the take rate.