
Block (XYZ) · Financial Technology
Block Q2 2026 earnings: summary, key numbers & outlook
Results filed 5 Aug 2026 · Quarter ended 30 Jun 2026
Slides (29 pages)Press release ↗Investor relations ↗
Summaries and transcripts are machine-generated and can contain errors.
In brief
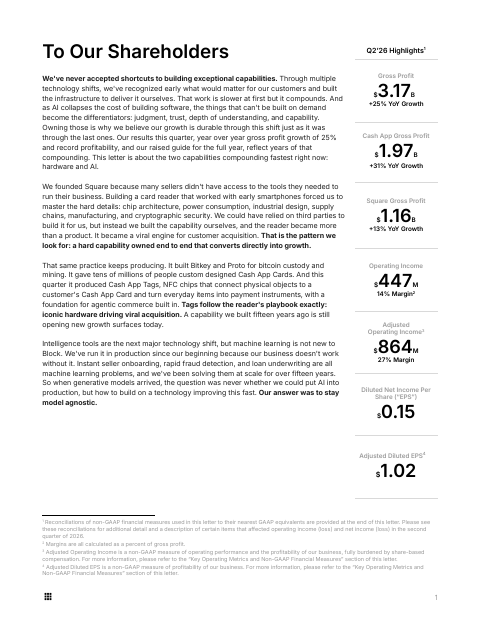
Block's Q2 2026 gross profit grew 25% year over year to $3.17B, with Operating Income of $447M, record Adjusted Operating Income of $864M, GAAP diluted EPS of $0.15 and Adjusted Diluted EPS of $1.02.
Block grew gross profit 25% year over year to $3.17 billion, with Cash App up 31% and Square up 13%. Adjusted Operating Income reached a record $864 million, a 27% margin on gross profit. GAAP operating income was $447 million and GAAP diluted EPS was $0.15, held down by $365 million of contingencies, restructuring and other charges. Adjusted Diluted EPS grew 65% to $1.02.
Management raised its 2026 outlook to $12.51 billion of gross profit (up 21%), $3.47 billion of Adjusted Operating Income and $4.02 of Adjusted Diluted EPS. For Q3 it expects $3.13 billion of gross profit and $875 million of Adjusted Operating Income. The main tensions are bitcoin gross profit, which fell 31%, and loan losses, which rose 99% as lending grew. Management expects loss growth to moderate through the rest of 2026.
Slides & documents
Open the slide deck (PDF, 29 pages) ↗
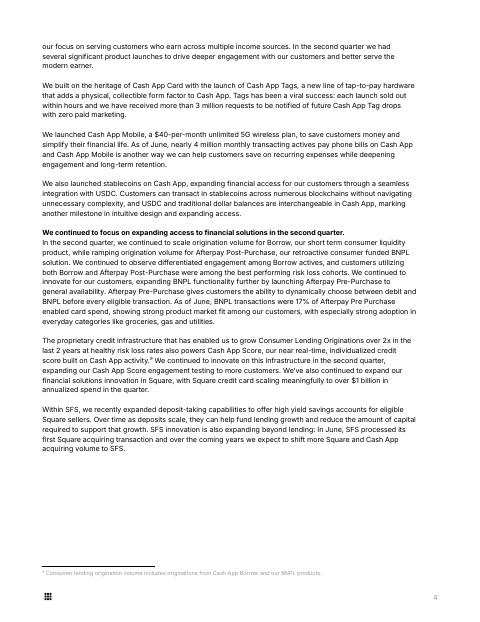
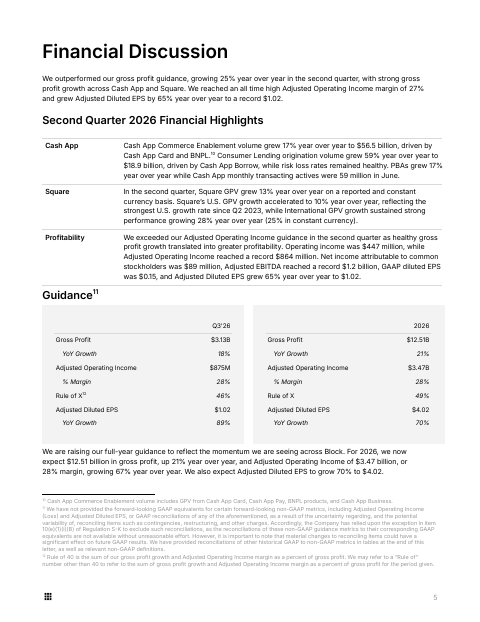
Showing the first 6 of 29 pages.
From Block investor relations
- Investor PresentationSlide deck ↗
- Preliminary Cash App Bitcoin Ecosystem RevenueSlide deck ↗
- Prepared Remarks from Earnings CallCFO commentary ↗
- Audio FileDocument ↗
- 10-QDocument ↗
SEC filing
Key numbers
- Gross profit · GAAP
- $3.17B
- Total net revenue · GAAP
- $6.6B
- Net income attributable to common stockholders · GAAP
- $89 million
- Diluted EPS · GAAP
- $0.15
- Adjusted Diluted EPS · non-GAAP
- $1.02
- Operating income · GAAP
- $447 million
- Operating income margin (% of gross profit) · GAAP
- 14%
- Net cash provided by operating activities · GAAP
- $1.0B
+25% YoY Growth
up 65% from a year ago
| Segment or metric | Value | Change |
|---|---|---|
| Cash App gross profit | $1.97B | +31% YoY Growth |
| Square gross profit | $1.16B | +13% YoY Growth |
| Square GPV | $72.8 billion | up 13% year over year |
| Cash App monthly transacting actives | 59 million | |
| Cash App Primary Banking Actives | 9.4 million | up 17% year over year |
| Cash App Commerce Enablement volume | $56.5 billion | up 17% year over year |
| Cash App Consumer Lending origination volume | $18.9 billion | up 59% year over year |
| Bitcoin Ecosystem gross profit | $72.0M | (31)% YoY |
Where each number comes from
- Gross profit: “Q2’26 Highlights1 Gross Profit $3.17B +25% YoY Growth Cash App Gross Profit $1.97B +31% YoY Growth Square Gross Profit $1.16B +13% YoY Growth”
- Total net revenue: “Segment revenue | $4,021 | $2,504 | $93 | $6,618 | $7,891 | $4,616 | $167 | $12,675”
- Net income attributable to common stockholders: “Net income attributable to common stockholders was $89 million, Adjusted EBITDA reached a record $1.2 billion, GAAP diluted EPS was $0.15, and Adjusted Diluted EPS grew 65% year over year to $1.02.”
- Diluted EPS: “Net income attributable to common stockholders was $89 million, Adjusted EBITDA reached a record $1.2 billion, GAAP diluted EPS was $0.15, and Adjusted Diluted EPS grew 65% year over year to $1.02.”
- Adjusted Diluted EPS: “We reached an all time high Adjusted Operating Income margin of 27% and grew Adjusted Diluted EPS by 65% year over year to a record $1.02.”
- Operating income: “Operating income was $447 million, while Adjusted Operating Income reached a record $864 million.”
- Operating income margin (% of gross profit): “Operating Income (Loss) Margin (%) of gross profit | 19% | 15% | 17% | (6%) | 14%”
- Net cash provided by operating activities: “Net cash provided by operating activities | 374 | 1,451 | 621 | 966 | 1,020 | 4,057”
- Cash App gross profit: “Q2’26 Highlights1 Gross Profit $3.17B +25% YoY Growth Cash App Gross Profit $1.97B +31% YoY Growth Square Gross Profit $1.16B +13% YoY Growth”
- Square gross profit: “Q2’26 Highlights1 Gross Profit $3.17B +25% YoY Growth Cash App Gross Profit $1.97B +31% YoY Growth Square Gross Profit $1.16B +13% YoY Growth”
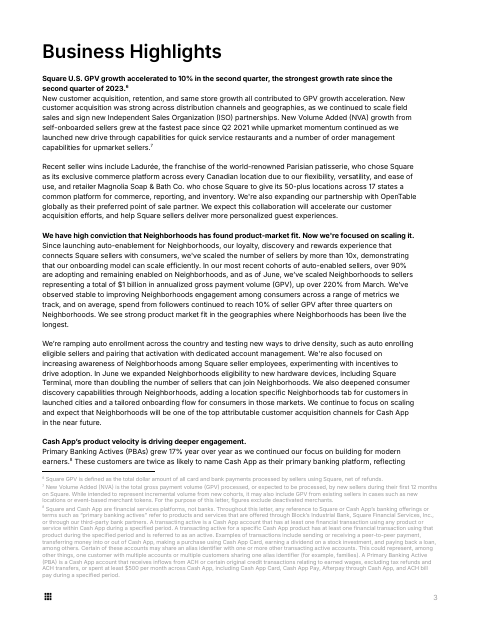
- Square GPV: “Square GPV grew 13% year over year in the second quarter on a reported and constant currency basis to $72.8 billion, reflecting strong GPV growth from new sellers.”
- Cash App monthly transacting actives: “Cash App monthly transacting actives were 59 million in June, and PBAs grew 17% year over year to 9.4 million.”
- Cash App Primary Banking Actives: “Cash App monthly transacting actives were 59 million in June, and PBAs grew 17% year over year to 9.4 million.”
- Cash App Commerce Enablement volume: “Cash App Commerce Enablement volume grew 17% year over year to $56.5 billion, driven by Cash App Card and BNPL.10 Consumer Lending origination volume grew 59% year over year to $18.9 billion”
- Cash App Consumer Lending origination volume: “Cash App Consumer Lending origination volume grew 59% year over year to $18.9 billion, driven largely by Cash App Borrow origination volume growth.”
- Bitcoin Ecosystem gross profit: “Bitcoin Ecosystem | 105 | 104 | 118 | 68 | 72 YoY Growth | 4% | 8% | 10% | (26)% | (31)%”
Copied from the press release ↗ and other documents in the SEC filing ↗. A figure is published only if its sentence is in the filing.
| From the filing | Q2 2026 | vs year ago | vs last quarter |
|---|---|---|---|
| Revenue | $6.6B | +9.3% | +9.3% |
| Operating income | $446.9M | −7.7% | — |
| Net income | $88.5M | −83.6% | — |
| Diluted EPS | $0.15 | −82.8% | — |
| Free cash flow | $966.6M | +181.8% | +3.4% |
| Gross margin | 47.8% | +5.9 pts | −0.2 pts |
| Operating margin | 6.8% | −1.2 pts | +9.6 pts |
Calculated by code from XBRL, not by the model.
Outlook
| Metric | Period | Outlook |
|---|---|---|
| Gross profit | Q3’26 | $3.13B |
| Adjusted Operating Income | Q3’26 | $875M |
| Adjusted Diluted EPS | Q3’26 | $1.02 |
| Gross profit | 2026 | $12.51 billion |
| Adjusted Operating Income | 2026 | $3.47 billion |
| Adjusted Diluted EPS | 2026 | $4.02 |
Key takeaways
Gross profit growth of 25% led by Cash App
Gross profit reached $3.17B, with Cash App up 31% to $1.97B and Square up 13% to $1.16B. Financial Solutions gross profit grew 43%, driven by Cash App Consumer Lending.
Adjusted profit hit records; GAAP profit lagged
Adjusted Operating Income was $864M, a 27% margin, and Adjusted Diluted EPS was $1.02. GAAP operating income was $447M and diluted EPS was $0.15, after $365 million of contingencies, restructuring and other charges.
Full-year guidance raised across gross profit and EPS
Block now expects $12.51 billion of gross profit, $3.47 billion of Adjusted Operating Income and $4.02 of Adjusted Diluted EPS for 2026. Q3 guidance is $3.13B of gross profit and $875M of Adjusted Operating Income.
Square U.S. GPV growth accelerated to 10%
Square GPV grew 13% to $72.8 billion, and U.S. growth was the strongest since Q2 2023. A one-time tariff reimbursement added about two points to Square gross profit growth.
Bitcoin gross profit fell 31%; lending losses rose
Bitcoin Ecosystem gross profit declined 31%, driven by a reduced fee on certain bitcoin transactions on Cash App. Transaction, loan, and consumer receivable losses increased 99% on a GAAP basis, though Block expects growth in these losses to moderate through the rest of 2026.
Charts
Fourth quarter worked out from the annual figure.
Data
| Q4 2024 | $6.0B * |
| Q1 2025 | $5.8B |
| Q2 2025 | $6.1B |
| Q3 2025 | $6.1B |
| Q4 2025 | $6.3B * |
| Q1 2026 | $6.1B |
| Q2 2026 | $6.6B |
| Q3 2026 | $6.7B |
Data
| Q1 2025 | $0.30 |
| Q2 2025 | $0.87 |
| Q3 2025 | $0.74 |
| Q1 2026 | -$0.52 |
| Q2 2026 | $0.15 |
| Q3 2026 | $0.92 |
Fourth-quarter EPS appears once the press release is read; filings report it only for the full year.
Data
| Q4 2024 | 0.2% |
| Q1 2025 | 5.7% |
| Q2 2025 | 8.0% |
| Q3 2025 | 6.7% |
| Q4 2025 | 7.8% |
| Q1 2026 | -2.8% |
| Q2 2026 | 6.8% |
| Q3 2026 | 6.4% |
Data
| Q4 2024 | -$13.2M |
| Q1 2025 | $101.5M |
| Q2 2025 | $343.0M |
| Q3 2025 | $1.4B |
| Q4 2025 | $579.8M |
| Q1 2026 | $935.0M |
| Q2 2026 | $966.6M |
| Q3 2026 | $972.0M |
Operating cash flow minus capital expenditure, from cash flow statements.
Questions
What were Block's main results in Q2 2026?
Gross profit was $3.17B, up 25% year over year. Operating income was $447 million, Adjusted Operating Income was a record $864 million, GAAP diluted EPS was $0.15 and Adjusted Diluted EPS was $1.02.
Why is GAAP EPS so much lower than Adjusted EPS?
GAAP results include $365 million of contingencies, restructuring and other charges in the quarter, plus an $88 million remeasurement loss on the bitcoin investment. Adjusted Diluted EPS excludes those items, along with intangible amortization and other items.
What is Block's guidance for the rest of 2026?
Block now expects 2026 gross profit of $12.51 billion (up 21%), Adjusted Operating Income of $3.47 billion (28% margin) and Adjusted Diluted EPS of $4.02. For Q3 it guides to $3.13 billion of gross profit, $875 million of Adjusted Operating Income and $1.02 of Adjusted Diluted EPS.
How did Cash App and Square perform?
Cash App gross profit grew 31% to $1.97B, helped by Consumer Lending originations up 59% to $18.9 billion. Square gross profit grew 13% to $1.16B, and Square GPV grew 13% to $72.8 billion.
What are the main risks or pressure points?
Bitcoin Ecosystem gross profit fell 31%, and transaction, loan, and consumer receivable losses rose 99% on a GAAP basis with loan growth. Cash App monthly transacting actives were flat at 59 million sequentially, up 3% year over year.