
Workday (WDAY) · Software
Workday Q2 FY2027 earnings: summary, key numbers & outlook
Results filed 27 Aug 2026 · Quarter ended 31 Jul 2026
Slides (24 pages)Press release ↗Investor relations ↗
Summaries and transcripts are machine-generated and can contain errors.
In brief
Workday reported fiscal 2027 second quarter total revenues of $2.649 billion, up 12.8% year-over-year, with subscription revenues of $2.471 billion, up 13.9% year-over-year.
Workday's second quarter revenue was $2.649 billion, up 12.8% from a year ago, and subscription revenue (the recurring part) was $2.471 billion, up 13.9%. Non-GAAP operating margin was 31.1% versus 29.0% a year earlier. Reported diluted EPS of $2.57 included a $1.52 per share tax benefit from an internal restructuring of intellectual property rights. Workday repurchased about 9.8 million shares for $1.3 billion, and operating cash flow fell to $520 million.
Management expects third quarter subscription revenue of $2.515 billion, up 12%, with a 30.0% non-GAAP operating margin. For the full year it now expects subscription revenue of $9.940 billion to $9.950 billion, up 13%, and raised its non-GAAP operating margin guidance to 31.0%. The main tension is that growth is slowing slightly while Workday keeps investing in agentic AI, and cash flow was lower than a year ago as buybacks continue.
Slides & documents
Open the slide deck (PDF, 24 pages) ↗

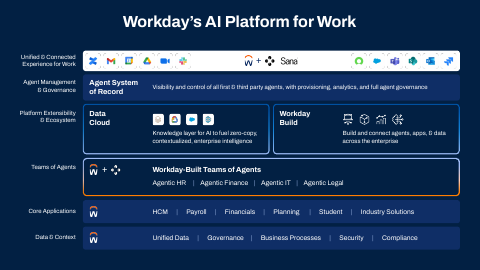
Showing the first 6 of 24 pages.
From Workday investor relations
- Q2 FY27 Earnings Prepared RemarksCFO commentary ↗
- Q2 FY27 Earnings Conference CallWebcast replay ↗
- Q2 FY27 Financial ResultsDocument ↗
- Q2 FY27 10-QDocument ↗
SEC filing
Key numbers
- Total revenues · GAAP
- $2.649 billion
- Net income · GAAP
- $632.0M
- Diluted net income per share · GAAP
- $2.57
- Non-GAAP diluted net income per share · non-GAAP
- $2.75
- Operating income · GAAP
- $313 million
- Non-GAAP operating margin · non-GAAP
- 31.1%
- Operating cash flows · GAAP
- $520 million
- Free cash flows · non-GAAP
- $460 million
up 12.8% from the second quarter of fiscal 2026
up from $228 in the same period last year
compared to $0.84 in the same period last year
compared to $2.21 in the same period last year
compared to $248 million in the same period last year
compared to 29.0% in the same period last year
compared to $616 million in the same period last year
compared to $588 million in the same period last year
| Segment or metric | Value | Change |
|---|---|---|
| 12-month subscription revenue backlog | $9.034 billion | up 14.2% from the same period last year |
| Total subscription revenue backlog | $27.403 billion | increasing 8.0% year-over-year |
| Customers using at least one organic agent | more than 5,500 | up more than 35% from last quarter |
| Professional services revenues | $178.0M | compared to $179 in the same period last year |
Where each number comes from
- Total revenues: “Total revenues were $2.649 billion, an increase of 12.8% from the second quarter of fiscal 2026.”
- Net income: “Provision for (benefit from) income taxes | (305) | 76 | (172) | 111 Net income | $632 | $228 | $854 | $296”
- Diluted net income per share: “Diluted net income per share was $2.57, compared to diluted net income per share of $0.84 in the same period last year.”
- Non-GAAP diluted net income per share: “Non-GAAP diluted net income per share was $2.75, compared to non-GAAP diluted net income per share of $2.21 in the same period last year.”
- Operating income: “Operating income was $313 million, or 11.8% of revenues, compared to an operating income of $248 million, or 10.6% of revenues, in the same period last year.”
- Non-GAAP operating margin: “Non-GAAP operating income for the second quarter was $824 million, or 31.1% of revenues, compared to a non-GAAP operating income of $680 million, or 29.0% of revenues, in the same period last year.”
- Operating cash flows: “Operating cash flows were $520 million compared to $616 million in the same period last year.”
- Free cash flows: “Operating cash flows were $520 million compared to $616 million in the same period last year. Free cash flows were $460 million compared to $588 million in the same period last year.”
- 12-month subscription revenue backlog: “12-month subscription revenue backlog was $9.034 billion, up 14.2% from the same period last year.”
- Total subscription revenue backlog: “Total subscription revenue backlog was $27.403 billion, increasing 8.0% year-over-year.”
- Customers using at least one organic agent: “More than 5,500 customers now use one or more of Workday’s organic agents, up more than 35% from last quarter.”
- Professional services revenues: “Subscription services | $2,471 | $2,169 | $4,826 | $4,228 Professional services | 178 | 179 | 365 | 360 Total revenues | 2,649 | 2,348”
Copied from the press release ↗ and other documents in the SEC filing ↗. A figure is published only if its sentence is in the filing.
| From the filing | Q2 FY2027 | vs year ago | vs last quarter |
|---|---|---|---|
| Revenue | $2.6B | +12.8% | +4.2% |
| Operating income | $313.0M | +26.2% | −7.4% |
| Net income | $632.0M | +177.2% | +184.7% |
| Diluted EPS | $2.57 | +206.0% | +195.4% |
| Free cash flow | $460.0M | −21.8% | −25.3% |
| Operating margin | 11.8% | +1.2 pts | −1.5 pts |
Calculated by code from XBRL, not by the model.
Outlook
| Metric | Period | Outlook |
|---|---|---|
| Subscription revenues | fiscal 2027 third quarter ending October 31, 2026 | $2.515 billion |
| Non-GAAP operating margin | fiscal 2027 third quarter ending October 31, 2026 | 30.0% |
| Subscription revenues | fiscal 2027 full year ending January 31, 2027 | $9.940 billion to $9.950 billion |
| Non-GAAP operating margin | fiscal 2027 full year ending January 31, 2027 | 31.0% |
| Operating cash flows | fiscal 2027 | $3.450B |
| Capital expenditures | fiscal 2027 | $270M |
| Free cash flow | fiscal 2027 | $3.180B |
Key takeaways
Subscription revenue grew faster than total revenue
Subscription revenues were $2.471 billion, an increase of 13.9%, while total revenues rose 12.8% to $2.649 billion. Professional services was flat at $178 versus $179.
Non-GAAP operating margin expanded to 31.1%
Non-GAAP operating margin was 31.1% compared to 29.0% a year earlier. GAAP operating margin was 11.8% versus 10.6%.
Reported EPS inflated by a one-time tax benefit
Diluted net income per share was $2.57, including a tax benefit of $1.52 per share from an intra-entity IP transfer. Non-GAAP diluted EPS was $2.75 versus $2.21.
Cash flow fell while buybacks accelerated
Operating cash flows were $520 million versus $616 million, and free cash flows were $460 million versus $588 million. Workday repurchased approximately 9.8 million shares for $1.3 billion and authorized up to an additional $4.0 billion.
AI adoption rising; full-year outlook nudged up
AI drove more than 25% of new ACV and more than 5,500 customers use an organic agent. Full-year subscription revenue guidance is $9.940 billion to $9.950 billion with non-GAAP operating margin raised to 31.0%.
Charts
Fourth quarter worked out from the annual figure.
Data
| Q3 FY25 | $2.2B |
| Q4 FY25 | $2.2B * |
| Q1 FY26 | $2.2B |
| Q2 FY26 | $2.3B |
| Q3 FY26 | $2.4B |
| Q4 FY26 | $2.5B * |
| Q1 FY27 | $2.5B |
| Q2 FY27 | $2.6B |
Data
| Q3 FY25 | $0.72 |
| Q1 FY26 | $0.25 |
| Q2 FY26 | $0.84 |
| Q3 FY26 | $0.94 |
| Q1 FY27 | $0.87 |
| Q2 FY27 | $2.57 |
Fourth-quarter EPS appears once the press release is read; filings report it only for the full year.
Data
| Q3 FY25 | 7.6% |
| Q4 FY25 | 3.4% |
| Q1 FY26 | 1.7% |
| Q2 FY26 | 10.6% |
| Q3 FY26 | 10.6% |
| Q4 FY26 | 6.9% |
| Q1 FY27 | 13.3% |
| Q2 FY27 | 11.8% |
Data
| Q3 FY25 | $359.0M |
| Q4 FY25 | $1.0B |
| Q1 FY26 | $421.0M |
| Q2 FY26 | $588.0M |
| Q3 FY26 | $550.0M |
| Q4 FY26 | $1.2B |
| Q1 FY27 | $616.0M |
| Q2 FY27 | $460.0M |
Operating cash flow minus capital expenditure, from cash flow statements.
Questions
How did Workday perform in Q2 fiscal 2027?
Total revenues were $2.649 billion, up 12.8% year-over-year, and subscription revenues were $2.471 billion, up 13.9%. Non-GAAP operating margin was 31.1% versus 29.0% a year earlier.
Why was GAAP EPS so much higher than last year?
Diluted EPS was $2.57 versus $0.84, including a $1.52 per share tax benefit from an intra-entity transfer of intellectual property rights in an internal restructuring. Non-GAAP diluted EPS was $2.75 versus $2.21.
What is Workday's outlook for fiscal 2027?
Workday expects full-year subscription revenue of $9.940 billion to $9.950 billion, growth of 13%, and raised non-GAAP operating margin guidance to 31.0%. Its slide also shows operating cash flows of $3.450B and free cash flow of $3.180B.
What is guidance for the third quarter?
Workday guided fiscal Q3 subscription revenues to $2.515 billion, growth of 12%, with a non-GAAP operating margin of 30.0%. Total revenues are guided to $2.690B, up 11%, per the investor presentation.
How is Workday returning capital and what happened to cash flow?
Workday repurchased about 9.8 million Class A shares for $1.3 billion and its board authorized up to $4.0 billion more. Operating cash flows were $520 million versus $616 million a year earlier, and free cash flows were $460 million versus $588 million.
Call recording
Call recording on YouTube ↗. Official replay ↗.